This report examines the gap between US and Nordic childcare systems. The United States funds public childcare at around one-fifth the Nordic level and leaves the rest to families. Families absorb fifteen-thousand-dollar fees per child per year or the foregone earnings of caregivers; childcare workers are paid wages too low for a professional workforce; US child poverty runs four times the Nordic rate. Every Nordic country closed the gap the same way: funding care publicly and paying workers professionally. A similar system in the US would cost a fraction of what it once did. A handful of US states and cities are following that path.
The US-Nordic Childcare Gap
"These children are future citizens, and if they are neglected in these early years it will hurt not only the children themselves, but the community as a whole. Where state help is needed, it should be given; and when states are incapable of giving sufficient help, it should be forthcoming on a national scale."
Eleanor Roosevelt, September 8, 1945, as WWII childcare centers were closing across the country
US Path
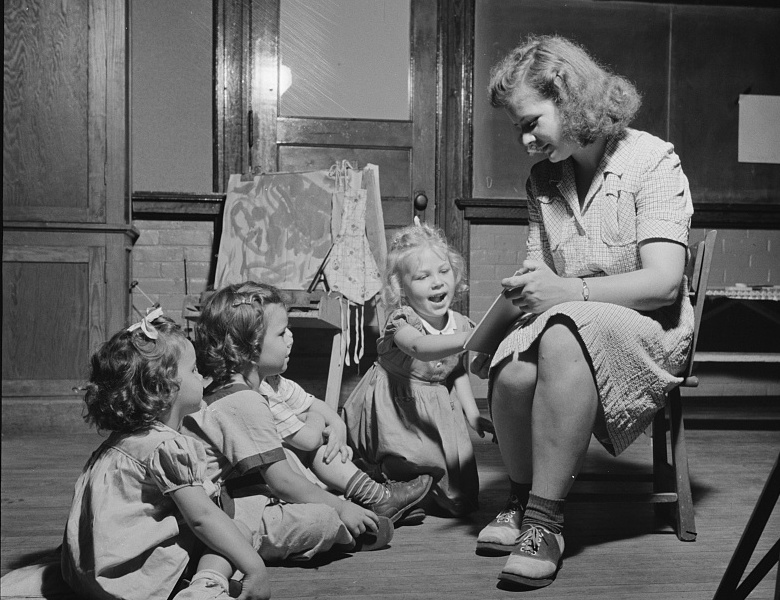
During World War II, the federal government built public childcare centers so that mothers could work in shipyards and factories. It was, as the economist Claudia Goldin noted, "a national, practically universal, federally funded preschool program. It is, to this day, the only one." When the war ended, the centers closed. The program had been built for the war effort, not for families. Nothing replaced it.
Federally funded childcare center. New Britain, CT, 1943. Photo: Gordon Parks
In 1971, Congress passed the Comprehensive Child Development Act, a bipartisan bill to establish universal childcare. President Nixon vetoed it. His speechwriter, Pat Buchanan, drafted a message warning against "the vast moral authority of the National Government" being committed "to the side of communal approaches to child rearing over against the family-centered approach."
The veto held. In the 55 years since, no federal bill has come as close. The US settled for a patchwork of targeted programs for the lowest-income families.
Nordic Path
Where the US failed, many other countries succeeded. The most complete public childcare systems are found in Nordic countries: Denmark, Finland, Norway, and Sweden. Childcare in these countries is universal and funded primarily by taxes. Municipal centers, staffed by public employees, provide the care.
Nordic countries built public childcare through political contest, rather than consensus. In 1934, Swedish social scientists Alva and Gunnar Myrdal argued for sharing the responsibility of child-rearing between families and society. It took forty years of organizing by labor unions, women's movements, and social democratic parties before Sweden passed its National Preschool Act in 1975.
Råå Day Care Center, Helsingborg (Sweden). Photo: Adam Mørk
Each country took its own path. Denmark, Finland, and Norway passed national childcare frameworks in the 1960s and 70s and later made care a universal legal right: Finland in 1996, Denmark in 2004, Norway in 2009. Today, between 65 percent and 80 percent of young children in every Nordic country are enrolled in public childcare.
At a Glance
Put side by side, the gap is stark. UNICEF ranks the United States 40th out of 41 wealthy countries on childcare. Nordic systems rank near the top and have broad public support. This report examines the gap between these systems: where it comes from, what it costs, and what it would take to close it.
The US-Nordic Childcare Gap at a Glance
United States
Nordics
Childcare cost to families
$15K/yr
$0–4K/yr
Public childcare and pre-K enrollment
14%
73%
Childcare worker pay
Near poverty
Professional
Public ECEC funding (ages 0–5)
0.3% of GDP
1.3% of GDP
Adults out of work for childcare
3.8%
~0.5%
Resources and Systems
Resources and Need
Before digging into the gap, consider the financial resources available in the US and Nordic countries. A common defense of the US childcare gap is that the US is unable to afford public daycare, either by lacking the resources or having too many kids. This claim fails against the data. The US has roughly the same financial resources per young child as the Nordic countries (see chart 1). And these resources are about four times the world average.
The US and Nordic countries have similar per child resources
GDP per 0–5 year old, PPP int'l $ millions, 2023
Chart 1. National financial resources per young child
It is indisputable, however, that many families with young children living in the US cannot afford daycare. This is precisely because the US lacks public systems; our society can certainly afford to care for young children. No one doubts that society can afford kindergarten, yet these same families can only afford kindergarten because it is a public service.
Finland has fewer financial and economic resources than the US but manages to be a world leader in reducing child poverty. Finland built its systems without oil wealth or a colonial empire. Meanwhile, Massachusetts, with wealth to match any Nordic country, falls far short on childcare.
Non-financial resources matter too: time and opportunity cost. Young children in every country need full-time supervision. Someone feeds them, watches them, teaches them, every day, for years. The real question is how we organize this process.
In other words, someone pays either way. The Nordic countries pay through taxes. The US pays through outrageous private market fees and the foregone earnings of caregivers.
Funding and Enrollment
If the resources and needs are the same, the US-Nordic gap must come from funding decisions. It does. In the Nordic countries, childcare is a public service. In the US, it is a private expense. The US funds public childcare and early education for children under 6 at 0.27 percent of GDP. The Nordic countries, by comparison, fund theirs at around 1.3 percent of GDP (see chart 2). The public funding gap between bottom-ranked US childcare and top-ranked Nordic systems boils down to one percent of GDP.
The US funds almost no public daycare
ECEC funding, share of GDP, latest year
Chart 2. Public childcare and early education funding
Within US public funding for children age 0–5, the largest share goes to kindergarten (roughly $58 billion in 2024, or two-thirds of the total). Another $24 billion funds preschool, mostly Head Start and state-funded pre-K programs. Some of the childcare programs, like SSBG day care, IDEA special education for ages 3–5, and MIECHV home visiting, barely register at all when compared to a 32 trillion dollar economy.
The US has a smaller public sector overall: general government spending runs 39.0 percent of GDP versus a Nordic average of 50.0 percent. But the childcare funding gap is disproportionate even by that standard. Denmark funds childcare at 1.2 percent of GDP. Finland at 1.3 percent. Norway at 1.2 percent. Sweden at 1.5 percent. Vermont, the US state that funds childcare the most, directs 0.49 percent, less than half of any Nordic country. US public funding for childcare is simply absent.
Public funding creates public slots. Public slots create enrollment. In the United States, public care for children begins in earnest at age 5. Kindergarten is a public service, funded by taxes, open to every child. Every Nordic country treats childcare and preschool the same way.
Nordic countries enroll children starting at age 1, when parental leave ends. By age 3, enrollment exceeds 80 percent in every Nordic country (see chart 3). In the US, public enrollment stays below 15 percent through age 3, climbs to roughly 40 percent at age 4 as some states offer pre-K, and jumps to 89 percent at age 5 when kindergarten begins. A few cities and states are trying to push public care further to younger ages. Otherwise, US families are mostly on their own.
Nordic children enter public care at age 1. US children wait until age 5.
Enrollment in public ECEC programs, by age, percent, 2023–2024
Chart 3. Public childcare enrollment by age
The childcare gap between the US and the Nordic countries is the result of two missing benefits. Nordic parents receive roughly a year of paid parental leave, which carries the family through infancy. Public childcare then takes over from age 1. The US has no federal paid leave, and the federal programs aimed at young children (Early Head Start and childcare vouchers) together reach only 3 to 7 percent of children under 3.
Workforce
Beyond funding and enrollment, a workforce is needed to deliver childcare and early childhood education, both highly labor-intensive. The current US childcare workforce is too small to staff a Nordic-style system.
The US has about 1.22 million formal childcare workers across daycare, preschool, and kindergarten: 520,180 daycare workers, 445,100 preschool teachers, 141,720 teaching assistants in daycare, and 114,410 kindergarten teachers (OEWS, May 2024). Another 421,000 are informal caregivers, mostly self-employed family daycare providers and nannies in private households (bd CPS, 2024). By category, nearly half of the US daycare workforce is informal, with limited job benefits and protections.
Divided by the 22.1 million children age 0–5, the US has 5.5 formal childcare workers per 100 young children. The four Nordic countries average 21.7 per 100, about four times the US ratio (see chart 4). The same informal categories add only a few thousand workers per Nordic country because public coverage is near-universal.
Nordic children have four times as many formal childcare workers
ECEC workers per 100 children (age 0–5), 2024
Chart 4. Childcare workforce ratio
The United States has the same resources and needs as Nordic countries but leaves childcare to the private market. Without public funding, the workforce stays small and slots stay scarce. Families who can afford care often cannot find it; much of the country is a childcare desert.
Across Every State
Pat Buchanan, who drafted Nixon's veto message, admitted later on NPR what the veto was about: "If we hadn't stopped it, I think you'd have an entitlement program now of enormous size with these federal day care centers, and they would be growing and growing and growing once you got it on the books."
Congress last came close to a federal childcare bill in 1971. Since then, the only path to public childcare runs through the 50 states, one at a time. The 55 years since the veto are the test of whether that path gets there.
The state-by-state path has yet to produce a public childcare system. Every state runs a private market with public subsidies layered on top. Funding spans a narrow range, all of it below Nordic levels.
At the bottom, six states (Idaho, Indiana, Nevada, Ohio, Wisconsin, and Wyoming) put in only the minimum state funds required to unlock federal matching dollars (Child Care Aware, 2025). In those states, public childcare reaches some of the lowest-income families eligible for federal subsidies; other families pay out of pocket. At the top, Vermont marks the ceiling, still well below the Nordic floor.
A common defense of the US childcare gap is that Nordic countries are small and homogeneous, more comparable to US states than to the country as a whole. The comparison cuts the other way. Nordic countries are similar in scale to mid-sized US states, and even at that scale they outfund every one of them.
The maps below show four metrics at the state level: resources per young child, public funding, enrollment in public care, and childcare workforce share. On resources, US states often match or exceed Nordic countries. On public funding, enrollment, and workforce share, they fall behind.
Figures
Maps A-D. State-level comparison
What the Gap Costs
Cost to Families
In the US, private full-time childcare costs about $15,000 per child per year. At a household income of $200,000, that is steep but manageable. At an income of $40,000, it is more than a third of everything the family makes before taxes. For a family with two children, that is $30,000 a year, close to the full take-home pay of a worker paid $20 an hour.
In Sweden, the public sector caps the fee at about $2,100 a year per child. Lower-income families pay less, and fees drop further for second and third children. The Swedish cap is a small fraction of the $15,000 US price.
In the US, families respond to the private childcare market in three ways: they pay and absorb the cost for years, often at the expense of savings, retirement, or housing; they rely on grandparents and informal arrangements, shifting the burden to an older generation; or a parent, overwhelmingly the mother, leaves work.
3.8 percent of US working-age adults are out of the labor force for childcare (CPS, 2022). In the Nordic countries, the figure is under 1 percent (see Chart 5). Nine in ten of these sidelined adults are women. Outside of recessions, more Americans are out of work for childcare than for unemployment.
US parents leave work for childcare at ten times the Nordic rate
Age 20–64, out of work for childcare, 2022
Chart 5. Adults out of work for childcare
US child poverty runs three to five times the Nordic rate
Child poverty rate, 2022
Chart 6. Child poverty rate
The childcare gap pushes US families into poverty. Among mothers of young children who left work for caregiving, one in three lives in poverty. Among those who stayed employed full-time, the rate is under 10 percent. For single mothers of young children, the poverty rate reaches 40 percent (CPS ASEC, 2025). The pattern runs in one direction: missing childcare services push women out of the workforce, and workforce exit pushes families into poverty.
The downstream effect shows up in child poverty. US child poverty is 20.8 percent; Nordic countries all fall between 4 and 9 percent: Denmark 4.2, Finland 4.6, Norway 7.0, Sweden 8.4 (see chart 6).
Cost to Employers
Labor force participation for mothers with children under 6 is 68.0 percent, over ten points lower than for mothers whose youngest child is school-age. That gap closes when children reach kindergarten and free public education begins. Before that, 7.3 million working-age adults are out of the labor force for childcare, including 2.2 million with a bachelor's degree or higher. Employers competing for workers are drawing from a labor pool that is structurally smaller than it needs to be.
The cost is large. The Bipartisan Policy Center estimated the US economy loses $22–33 billion a year from gaps in the existing private childcare supply, where families who want a slot cannot find one nearby. ReadyNation put the broader cost, including lost earnings and lost productivity, at $172 billion a year. These costs fall on employers as unfilled positions, turnover, and absenteeism. Some employers pay these costs directly, subsidizing or operating their own childcare to retain workers.
In a national survey of working parents, more than 60 percent reported missing work, arriving late, or being distracted because of childcare problems in the past three months alone. More than a quarter had quit a job. Nearly one in five had been fired. The absence of childcare is an obstacle for these parents and their employers.
Nordic employers have access to public childcare that US employers lack. Public childcare covers children from infancy until school begins. Workers stay on the job. Mothers stay in the workforce. Employers keep trained staff and hire from a full labor pool. This system does the work the unpaid stay-at-home wife used to do in the American economy, now organized publicly.
Cost to Workers
The US childcare system fails families who need care and employers who need workers. It also fails the people who provide the care.
A childcare worker in the US is paid $15.41 an hour. Less than a dog walker, less than nearly every other occupation in the country (see Diagram 1). That wage falls short of what childcare costs for the worker's own children.
Who else is paid $15 an hour?
Occupations paid closest to childcare workers in the US, 2024
Diagram 1. US childcare worker wage comparators
The US childcare system runs on worker poverty. Childcare workers effectively subsidize the cost of care with wages too low to live on. If they were paid what the work requires, comparable to a kindergarten teacher, the private market price would be even further out of reach.
In every Nordic country, childcare workers are paid close to the typical wage (84 percent in Finland and Sweden, 94 percent in Norway) and work as public employees with healthcare, a pension, paid vacation, and job security. In the US, most childcare workers lack all of these. The pay gap including benefits is very large, and drives turnover. Nordic systems retain trained staff over years. US centers cycle through workers who leave for any job that pays a dollar more, because almost every job does.
Bamsebo barnehage (Norway), ages 1–5
Why Public Childcare Works
The Wage-Cost Trap
The previous sections traced what the childcare gap costs families, employers, and workers. Each group absorbs the damage individually. The market cannot fix that.
Closing the enrollment gap requires a much larger workforce. The US employs less than 1 percent of its workers in childcare. Nordic countries employ between 2 and 5 percent. Matching Nordic enrollment would mean tripling or quadrupling the childcare workforce, recruiting millions of additional workers that the current wage of $15.41 an hour cannot attract. To create the slots, the US needs the workers. To get the workers, it needs professional wages.
But higher wages raise the cost of care. In childcare, the price falls directly on families, because there is no public payer to absorb the difference. Brown and Herbst documented that a 10 percent minimum wage increase raises childcare prices 4–8 percent, compared to 0.4 percent at grocery stores. Labor is roughly 70 percent of childcare costs, and margins are too thin to absorb it. Raising childcare worker wages makes care unaffordable for parents. And those parents are at the earliest stage of their careers, when their incomes are lowest, facing the highest costs.
Care violates what markets usually need to function. Parents have limited ability to judge the quality of care their infant receives. Power between caregivers and recipients is unequal. Relationships are sticky: replacing a trusted worker imposes real costs on the child. And unlike manufacturing, care resists the automation that lets wages rise without raising prices. These are structural features of the thing being sold, rather than market failures to be patched.
Every country that solved this problem solved it the same way: the government became the primary funder, set professional wages, and charged families a fraction of the cost. Every private-market path from $15 an hour to a professional wage runs through higher prices that families cannot pay. The only question is whether the public sector steps in.
The Means-Testing Trap
The last time the US tried to break this trap, the design of the fix revealed a built-in flaw of income-restricted programs. Raise quality, and the families just above the cutoff pay the most.
The Build Back Better Act of 2021 showed how. It proposed improvements to the childcare system, including wage standards. The wage standards would have raised costs across the entire market, but subsidies were limited to lower-income families, so families just above the cutoff faced a $13,000 price increase. They would pay higher prices from the quality mandate, receive no subsidy, and pay taxes to fund the program for families below the line. Those families turn against the program.
Means-tested programs also fail at reach. The main federal childcare subsidy reaches only about 14 percent of the children eligible for it. Funding is capped by Congressional appropriation, not by the number of eligible families. States ration the rest by waitlist.
Even if the existing programs were fully funded, they would still miss people. Means-testing inherently imposes administrative burden: determining eligibility requires tax filings, income verification, and ongoing paperwork that low-income families with volatile incomes often cannot reliably produce. Subsidize-the-poor has been the US approach for decades, and most of the poor go unserved.
The Universal Answer
In Nordic countries, public investment creates a professional workforce, which produces quality care, which builds public trust, which sustains the investment. Conservative, liberal, and socialist parents send their kids to the same daycares. Even Finland's current right-wing government has kept childcare intact, because dismantling it would mean taking care away from its own base. The system is politically untouchable because every family depends on it.
In the United States, the feedback runs the other direction. Parents pay a lot. Workers are paid little. Both sides of the market are broken at the same time. Underfunding produces low wages, which cause turnover, which erodes quality, which erodes trust, which becomes the argument against investment.
Universal programs break this trap. The cost of childcare is small relative to the whole economy but enormous relative to a young family's budget. One percent of GDP, spread across the tax base, is a small share of what the public sector already spends. The same cost, concentrated on the families who need care right now, is $15,000 a child. The Nordic countries chose to spread it. The US chose to concentrate it. Spreading the cost is one reason universal works. There are two more.
First, universal programs deliver more to poor families than means-tested programs do. Means-tested programs stay small because only the poor benefit. Universal programs fund higher benefits because the middle class uses them and defends them. Second, universal care insures families against uneven needs. The cost of childcare varies with how many children a family has, whether those children have disabilities, and how long care is needed. Universal systems spread that variation across everyone.
Nuotti daycare centre (Finland). Architects: Verstas Arkkitehdit
Closing the Gap
A final objection to universal public childcare is that it restricts choice. The opposite is true. A private market offers the appearance of choice; a public system funds the choices families actually want to make. Finland makes this clear.
A tale of two systems
You have a child under 5. If you live in the United States, you choose between private childcare at about $15,000 per year and having one parent leave the workforce. If you live in Finland, you choose between public childcare at $0–4,080 per year and a home care allowance of roughly $5,000 per year paid to the parent (see Diagram 2). Same situation. Radically different options.
You have a child under 5.
What are your options?
United States
Private childcare
$14,760per year
More than in-state college tuition in 38 states
or
Leave the workforce
$0income
3.8% of US adults are out of work for childcare reasons
Both options cost the family.
Finland
Public childcare
$0–4,080per year
Income-scaled fees. Legal right from infancy.
or
Home care allowance
~$5,000per year
Paid to the parent. A real choice, not a last resort.
Both options help the family.
Diagram 2. Finland and US comparison
Finland grants every child a legal right to public childcare from infancy. The home care allowance is an option layered on top of a complete public system. Both options are funded. Both options are real. In any society, some parents prefer to care for their children at home. Finland gives them the freedom to do so, and lets them move between home care and public daycare as needs change. Staying home means lost income, so the allowance replaces part of it, preventing poverty. The allowance might delay some mothers' return to paid work. But every country has people who won't use the public childcare system. Policy determines whether those families end up in poverty. Finland accepts their choice and reduces their poverty.
The apparent freedom of the US private market is a constraint in disguise. Families pay rates that can total $150,000 for two children before kindergarten, if they can afford it at all. Lower-income families piece together informal arrangements, or a parent, usually the mother, leaves paid work. This is the daily emergency created when viable choices are never presented.
Finland (A Complete System)
Finland shows what a complete system looks like. Public childcare runs from the end of parental leave, around nine months, through the year before school starts at age seven. Fees are income-based, capped at roughly $340 per month for the first child, and free for the year before school. Staff ratios for children under three are one adult per four children.
The system was built over a century: first kindergarten in 1888, the Day Care Act in 1973, a universal legal right in 1996. Childcare workers are public employees with union-negotiated wages, pensions, and job security. Preschool teachers are paid roughly the same as elementary school teachers. The workforce is stable because the jobs are professional.
New York City
New York City is opening a public system age by age. Four-year-olds have free, full-day Pre-K, with roughly two-thirds of the age group enrolled. Three-year-olds have 3-K, with about half enrolled, though seats are unevenly distributed across the city. Below age three, the city is just getting started: a Birth-to-2 pilot launched in January 2026 with 200 free seats for infants and toddlers, and a 2-K program launching in September will offer 2,000 free full-day, full-year seats, with plans to reach 12,000 by fall 2027. Public childcare funding in New York City is 0.37 percent of GDP, above the national average of 0.26 percent but still well below Nordic levels.
Mayor Mamdani's goal is universal care from six weeks to five years. But the expansion is built on a private workforce. The typical childcare worker in New York City gets about $36,500 a year, while an elementary school teacher in the same city makes $95,000. Closing that gap has no mechanism in the current structure, and the wage gap will follow the program into every new age group it reaches.
Vermont
Vermont funds childcare at 0.49 percent of GDP with 33.1 percent enrollment, both the highest of any US state. Three- and four-year-olds get 10 hours a week of free universal pre-K. 76 percent of four-year-olds are enrolled. For younger children, the state offers a subsidy: in 2023, Act 76 created a dedicated 0.44 percent employer-side payroll tax as part of roughly $125 million a year in new funding. The governor vetoed it. The legislature overrode the veto. The subsidy pays private providers on a sliding scale, with no copay for lower-income families. But for children under three, the only option is the subsidy.
Vermont is the closest any US state has come to Nordic levels on the metrics in this report. But it is a subsidy in a private market, not a public system. Since Act 76, the number of providers has grown for the first time in a decade, and the number of families receiving subsidies has grown 48 percent. Families still find their own provider, and the state still needs thousands of additional slots. And the subsidies passed, but the wages did not fully follow: childcare workers went from about $13 an hour to roughly $18, real progress but not professional pay.
New Mexico
New Mexico is the first US state to make universal childcare an entitlement, free from infancy, open to every family regardless of income. In 2022, 70 percent of voters approved a constitutional amendment directing 1.25 percent of the Land Grant Permanent Fund, the state's mineral-revenue endowment, to early childhood education. In 2026, the legislature passed SB 241 to codify the universal program in state law. About half of four-year-olds and a fifth of three-year-olds are enrolled in state pre-K.
The entitlement is universal. The capacity is not. Of 194,000 eligible children, about 40,000 are served, roughly one in five. Fourteen of the state's 33 counties are childcare deserts, and there are only 32 licensed slots for every 100 children under two. The childcare workforce has grown 64 percent since 2019, against a 7 percent national decline, but from a base too small to meet the need. Poverty among childcare workers in the state has fallen from 27.4 percent in 2020 to 16 percent in 2024. New Mexico has the funding and the legal architecture. What it still lacks are the facilities and workers to turn the right into a reality.
Other efforts
Other US cities and institutions have set up pieces of public childcare without a full system. San Antonio funds four municipal pre-K centers through a voter-approved 1/8-cent sales tax, now reauthorized with a wider margin than the original 2012 vote. Washington, DC's 2022 Pay Equity Fund uses city revenue to lift early-childhood educator wages directly; it added hundreds of educators in its first year but was cut back in early 2026 and remains unfunded past FY 2027. The US military runs the largest employer-sponsored childcare system in the country: 97 percent of its child development centers are nationally accredited, versus 9 percent in the civilian sector. It works through enforcement of quality standards, funded training, and direct program subsidies, with force readiness as the rationale.
Getting universal right means more than access at the right age. It means full-day coverage so both parents can work, and full-year coverage that matches a working calendar. The US private market fails on all three. Where public pre-K exists, it usually ends at 3pm and stops for the summer. Working parents stitch the gaps themselves. In addition to expanding care, states have room to increase the hours of operation.
The case studies above show different approaches to the same problem, at different stages of progress. The cases closest to a public system (Finland's complete system, New Mexico's universal entitlement) are the ones built on universal principles.
The cost of a complete US system
A bottom-up calculation of what a complete US system would cost solidifies the principles drawn from cross-country comparison.
Specifically, a complete US childcare system, with high enrollment, would require roughly one trained worker for every four young children. And to recruit and retain these workers, the childcare worker wage, one of the lowest in the country, would need to rise toward a living wage, comparable with preschool teachers. Using these figures we can estimate what such a system would cost.
For kids age 0–4, a new universal Nordic-style public childcare system, with high enrollment and trained public sector workers, would require around 3 million new workers. Paying these workers a 25th percentile wage and public-sector benefits, along with 40 percent overhead for buildings, equipment, supplies, etc., is equivalent to 1.17 percent of GDP in 2025. Some of this is already funded by state systems covering preschool or by Head Start.
A Nordic-style system is a lighter lift than in the 1970s
Bottom-up estimate, percent of GDP
Chart 7. Cost of Nordic-style childcare for US
The US economy has grown much faster than typical wages for lower-wage jobs, while birth rates have fallen. As a result, childcare is a smaller lift today than in the past. In the early 1970s, the same system would have cost 3 percent of GDP, nearly triple today's 1.17 percent (see chart 7).
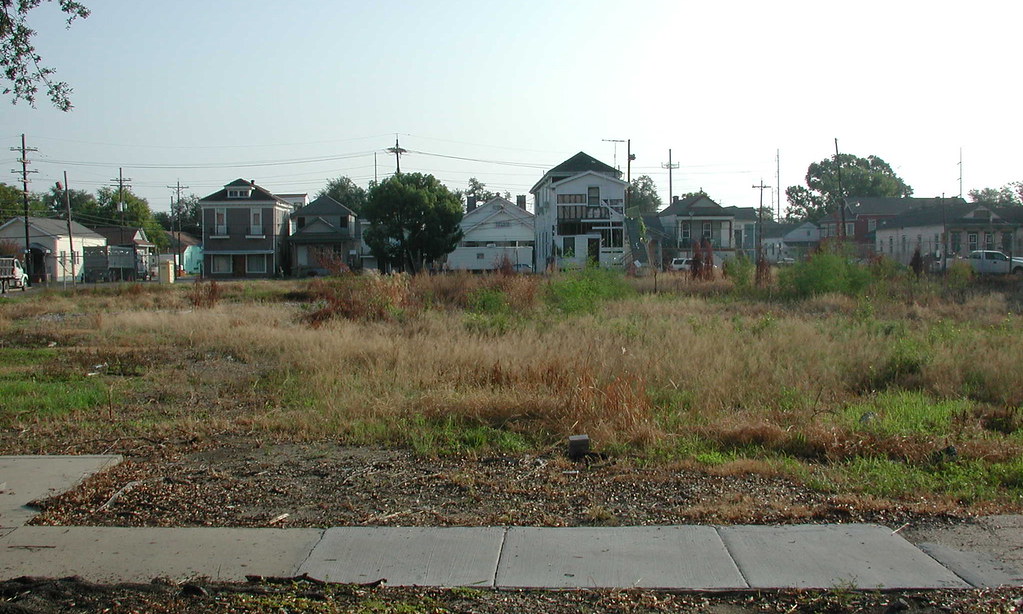
Empty lot (United States)
Arranging Childcare
Every argument in this report rests on a prior choice about how to see young children. That the US has the resources, that the need is the same, that the funding gap is one percent of GDP, that the workforce collapses without professional wages, that the market cannot fix it and means-testing cannot reach it, that universal design can. All of it follows from a framing question: is raising young children a private family matter or a shared public responsibility?
In the US, 57 percent of people say family members should primarily provide childcare for pre-school children. In Sweden, 5 percent agree. Three-quarters of Americans say families should cover the cost themselves; in Sweden, one-quarter. The gap is not an opinion difference at the margins. It is two societies answering the same question in opposite directions. Every Nordic public childcare system was built the moment the answer shifted.
The United States has come within reach of public childcare twice. Federal funding for the Lanham Act centers ended in 1946. In Cleveland, a court ruled that public childcare was "public funds for a private purpose," that caring for children who were not destitute was not a legitimate function of government. The 1971 bill died on Nixon's desk. Both times, the system was dismantled or blocked before families could depend on it.
Decades later, a few states and cities are working on better childcare arrangements. New Mexico wrote universal childcare into its constitution. Vermont overrode a governor's veto to fund it. New York City's mayor won office on a promise of free care from six weeks to five years, and in his first months began delivering it. None happened easily. All happened because people organized and fought for them.
"It's not a matter of my children and your children, but our children — all children."
Palme's argument is a political one, not a sentimental one. Universal systems work because they align everyone's interests. When every family uses the same system, the constituency to defend it is the entire electorate.
Buchanan understood this in 1971: once families have public childcare, they will never give it up. He meant it as a warning. It is the reason to finally build it.
Notes and Methodology
A note on terminology
Public care for young children goes by several names. "Childcare," "daycare," "preschool," "pre-K," and "kindergarten" describe different US programs by age and institutional form; internationally, OECD uses "early childhood education and care" (ECEC) as a single umbrella. In this report, childcare is the default cover term for the full 0–5 bundle, used the way OECD uses ECEC. Where space is tight, such as chart labels and axes, ECE, ECEC, and pre-K stand in for longer forms. Where a chart or statistic refers to a narrower slice (for example, kindergarten-only, or ages 0–2 only), the per-chart methodology below states it.
Chart 1. National financial resources per young child
Per-child figure is national GDP divided by population age 0–5. GDP is valued at purchasing-power parity (international dollars) so the world comparator is not distorted by price-level differences between rich and poor countries.
Norway: Mainland Norway GDP (Fastlands-Norge), which excludes oil and gas extraction, pipeline transport, and ocean transport. Those revenues flow into the Government Pension Fund under Norway's 3% spending rule (handlingsregelen) and are not available for current public spending. Mainland share computed from SSB table 11721: 4,021.6 / 5,304.9 NOK billion = 75.8% in 2023. Applied to Norway's PPP GDP.
World reference line: IMF WEO April 2026 PPPGDP world aggregate (G001) for 2023, UN World Population Prospects 2024 for population age 0–5.
Chart 2. Public preschool and childcare funding
OECD Social Expenditure Database (SOCX), Transactions detail, category TP521 "Early childhood education and care," as a share of GDP. Values use each country's latest available year: US 2023, Nordic countries 2021.
The 67 percent annotation on the US bar is kindergarten spending as a share of US TP521.
US funding decomposition cited in the §2 prose ("kindergarten ≈ $58 billion in 2024" + "$24 billion preschool"): the dollar amounts are bottom-up from primary US program data, and are broader than OECD TP521 in the sense that they cover gross 2024 program spending rather than the age-adjusted ECEC slice OECD reports.
Kindergarten ≈ $58 billion (2024): gross K spending from NCES F-33 per-pupil expenditure (latest available state-level data) × age-5 kindergarten enrollment from CPS October 2024. Note: this is the gross figure before OECD's "less 6 y o" 0.90 adjustment that strips the age-6 portion of US K out of TP521.
Other smaller programs (SSBG day care, IDEA Part B §619, MIECHV home visiting): individually less than $1 billion each, treated as background context. SSBG day care from ACF SSBG, IDEA from US Dept of Ed, MIECHV from HRSA MCHB.
Chart 3. Public childcare enrollment by age
Nordic rates from Eurostat UOE joint data collection and Eurostat demo_pjan population, 2023. Age 0–1 uses the UOE under-2 band; age 0 near 3 percent reflects the parental-leave year.
US rates by single-year age:
Ages 0–2: Early Head Start cumulative enrollment (61K, 78K, 119K) plus CCDF voucher monthly average (72K, 144K, 187K), discounted 20 percent for overlap, divided by ~3.65M per single-year age. IDEA Part C excluded as therapy rather than childcare. Yields 2.9, 4.9, and 6.7 percent.
Formal childcare workforce divided by population age 0–5. US uses BLS OEWS May 2024 establishment-based employment counts. Nordic countries use OECD Education at a Glance SDMX (DSD_EAG_UOE_NON_FIN_PERS, ISCED 0 teachers + aides, 2023), with Finland's aide count backfilled from StatFin tyokay_115q (AML 53111 + 53112) because Finland does not submit aide personnel to OECD. The Nordic composite ratio is built by summing workers and summing children across the four countries, then dividing.
US total of 1,221,410 workers ÷ 22.1M kids 0–5 (Census ACS 2023) = 5.5 per 100:
Childcare Workers (SOC 39-9011): 520,180
Preschool Teachers (SOC 25-2011): 445,100
Teaching Assistants in Child Care Services (SOC 25-9045): 141,720
Finland: 64,217 (StatFin AML 2342 + 53111 + 53112) ÷ 282,456 = 22.7 per 100. Finland's unitary varhaiskasvatus system is reported to OECD as consolidated ISCED 02.
Sweden: 121,485 (teachers 52,368 + aides 69,117) ÷ 657,790 = 18.5 per 100. Sweden's ISCED 02 includes förskoleklass (age 6) per OECD convention.
Composite: 355,842 ÷ 1,642,355 = 21.7 per 100
Informal childcare workers are counted separately. US informal is ~421,000, from bd CPS 2024 (OCC 4600 × informal COW1DT: self-employed, private household, unpaid). Nordic informal is small because public coverage is near-universal: Denmark ~2,000 privat pasningsordning (DST DAGTIL4), Norway ~3,000 dagmammaer (SSB 2004, scaled for post-2004 barnehage expansion), Sweden ~1,200 pedagogisk omsorg (Skolverket 2023), Finland ~1,000 outside the Varda registry.
Butcher et al. (Chicago Fed Insights, May 2024) defines the US childcare workforce as OCC 4600 + OCC 2300×IND 8470 + OCC 2545×IND 8470. bd CPS replication on 2019 data yields 1,708,591, matching Butcher's published 1.7M benchmark within 0.5%.
State map. Four indicators by US state with NYC inset
State-level and NYC values for the four indicators shown in the interactive map. Denominators use Census ACS 5-year 2023 state population by single year of age.
Resources per child, 2024. State gross product (BEA SAGDP1, current dollars) divided by state population age 0–5. NYC uses the 5-borough sum of county GDP (BEA CAGDP1). Color scale is winsorized at the 95th percentile.
Public childcare and pre-K funding, 2023 (% of GDP). OECD SOCX TP521-comparable four-layer build. National state-sum (0.260 percent of GDP) matches OECD's published US TP521 (0.268 percent) within 1 percent.
Head Start: state-sum from HS Program Facts. FY2019 state-sum matches OECD's published US HS exactly at $8.9 billion.
CCDF: ACF CCDF Table 3A total expenditures, calibrated to OECD's published US CCDF total ($13.39 billion).
Kindergarten × 0.90: state per-pupil expenditure × age-5 population × CPS national kindergarten enrollment rate × OECD's "less 6-year-olds" adjustment, calibrated to OECD's published US kindergarten ECEC total. Only the kindergarten layer is estimated; OECD itself estimates it per the EAG 2025 Sources & Methodologies annex.
NYC uses a 5-borough Comptroller-based method (0.37 percent of GDP). State range: Nevada 0.16 percent (low), Vermont 0.49 percent (high). Color scale is log.
Public childcare and pre-K enrollment, 2023 (% of children 0–4). Four-layer build: Early Head Start cumulative enrollment (HS Program Facts FY2024 Tables 1+2, scaled 1.39 to cumulative), plus CCDF vouchers 0–2 (Table 1 × Table 9 age shares, with a 20 percent EHS-CCDF overlap discount), plus NIEER state pre-K and Head Start ages 3–4. Age-5 kindergarten is excluded. NYC uses DOE 3-K and Pre-K, non-DOE Head Start, and NYC-share estimates of NY-state totals. State range: 3.0 percent (NH) to 39.3 percent (DC). National state-sum 14.8 percent. Color scale is linear.
Childcare and ECE workforce per 100 children 0–5, 2024.BLS OEWS May 2024 state file, occupation roll-up matching Chart 4:
Childcare Workers (SOC 39-9011)
Preschool Teachers (SOC 25-2011)
Teaching Assistants in Child Care Services (SOC 25-9045 × 0.103, the CCS industry slice)
Kindergarten Teachers (SOC 25-2012)
NYC uses OEWS MSA 35620 (NYC Metro) rather than the 5-borough count, because OEWS does not publish borough-level occupation employment; the Metro footprint is broader than the other three map indicators. Color scale is log.
Chart 5. Adults out of work for childcare
Working-age adults (20–64) whose stated main reason for not being in the labor force is family or home responsibilities, 2022.
US (3.8 percent): CPS Basic Monthly 2022, civilian noninstitutional adults age 20–64. The numerator counts respondents not in the labor force whose stated main reason is family or home responsibilities (bd CPSNILFREASON == "Family"), restricted to those with at least one own child under 18 in the household (PRNMCHLD > 0) so the reason is child-related caregiving rather than elder-care. All twelve months are pooled and weighted by BASICWGT; the denominator is the full age 20–64 civilian noninstitutional population over the same pooled months.
Eurostat FAM_CARE and the CPS NILF-for-family-with-children measure align approximately. Both exclude adults 65+ and adults who reduced hours while remaining in the labor force.
Absolute counts of 7.3 million and 2.2 million (bachelor's+): same filter as the share, expressed as a weighted 12-month average for 2022. 7.28 million total; 2.24 million further restricting to EDUC ∈ {COLL, ADV} (bachelor's, master's, professional, or doctorate).
CPS ASEC 2025 (calendar year 2024) person-level microdata. Universe: women age 18–64 with at least one own child under 5 in the household. Poverty metric is the Official Poverty Measure (PERLIS == 1), weighted by MARSUPWT.
Left work for caregiving: not in the labor force (A_LFSR in {6, 7}) with "taking care of home/family" as the stated reason (RSNNOTW == 3 or PYRSN == 2). Roughly 33 percent in OPM poverty.
Full-time, full-year employed: employed (A_LFSR == 1) with usual hours ≥ 35 and weeks worked ≥ 50. Under 10 percent.
Single mothers: female household head with no spouse present (family type 3), at least one own child under 5. Roughly 40 percent.
Chart 7. Cost of Nordic-style childcare for US
Bottom-up estimate of a Nordic-style universal system covering US children ages 0–4, annually from 1973 to 2025. Age 5 is excluded because public kindergarten covers it.
workers = population age 0–4 ÷ 4 (Nordic composite ratio of one worker per four children).
total = labor × 1.40 (overhead for buildings, training, administration).
share = total ÷ nominal GDP.
P25 weekly wage: 25th-percentile usual weekly earnings of full-time wage workers age 16+. Computed from EPI CPS microdata extracts using weekpay_noadj with orgwgt from the basic monthly file (1982 onward) and the May supplement (1973–1981). 1980 is interpolated linearly between 1979 and 1981 because EPI's 1980 May extract has no wage data.
Population age 0–4: SEER U.S. Population Data (single ages, adjusted, national file) for 1973–2024, summed across single-year ages 0–4. 2025 from Census Bureau Population Estimates Program, Vintage 2025, since SEER's release covering 2025 has not yet been published. SEER and PEP agree to within 1 percent on overlap years (2020–2024).
Nominal GDP: monthly from BEA, averaged to annual.
"3 million new workers" derivation: the formula above gives the total staffing required for the system, not net additions. For 2025, population age 0–4 of 18.5M ÷ 4 = 4.6M total workers. The US childcare workforce today is about 1.64M (1.22M formal from OEWS plus 0.42M informal from bd CPS, both documented under Chart 4). The "new" figure is the difference: 4.6M − 1.64M ≈ 3 million net additions. The 1.17 percent of GDP cost is calculated on the full 4.6M, not on net additions.
Cited in §"New York City" as "roughly two-thirds of the age group enrolled" (Pre-K, age 4) and "about half enrolled" (3-K, age 3). Numerator: NYC DOE Pre-K/3-K offers reported by Chalkbeat, May 2025: roughly 56,000 four-year-olds offered Pre-K seats (out of 70,000 capacity) and 44,000 three-year-olds offered 3-K seats. Denominator: NYC five-borough population by single year of age from Census ACS 5-year 2023, with age 3 and age 4 each at roughly 85,000–90,000. 56,000 ÷ ~85,000 ≈ 66 percent. 44,000 ÷ ~85,000 ≈ 52 percent.
Vermont case study wages
Pre-Act-76 baseline of about $13/hour from CSCCE Early Childhood Workforce Index 2024 — Vermont: $13.25/hour median ECE workforce wage from 2022 ACS (sample n<200; interpret with caution). Post-Act-76 figure of about $18/hour from BLS OEWS Vermont, May 2024: Childcare Workers (SOC 39-9011) median hourly wage $18.19 (1,120 employed). Vermont preschool teachers (SOC 25-2011) earn $21.52/hour median.
Workforce-exit share (3.8 percent): CPS 2022 (see Chart 5).
Finland inputs:
Public childcare fee ($0–4,080/yr): maxtaxa client fee, capped at €311/month for the first child as of August 2024, income-scaled below the cap, no fee below €30/month.
Home care allowance: kotihoidon tuki, approximately €370/month (~$5,000/yr) for parents caring at home.