MacroeconomicsWages & Income
After the thrill is gone
Consumer spending grew about 2 percent over the year ending December 2025, while total household income only increased by 1 percent. The difference between the two came out of saving. The personal saving rate fell from 6.4 percent in January 2024 — right at its 40-year average — to 3.6 percent by December 2025.
The saving rate decline started well after the San Francisco Fed estimated pandemic-era excess savings had been fully depleted, in early 2024. The driver seems to be the wealth effect.
Household wealth surged in 2024, driven by equity gains and rising home values. When that happens, spending tends to hold up even as income weakens — the gap shows up as a decline in the saving rate. This is not the first time. Spending has held up through an income slowdown several times in the past four decades, usually after a surge in household wealth. The first chart below shows four decades of consumer spending growth broken into two sources — income (blue) and saving drawdowns (green) — with four episodes marked. The second chart zooms into each one.
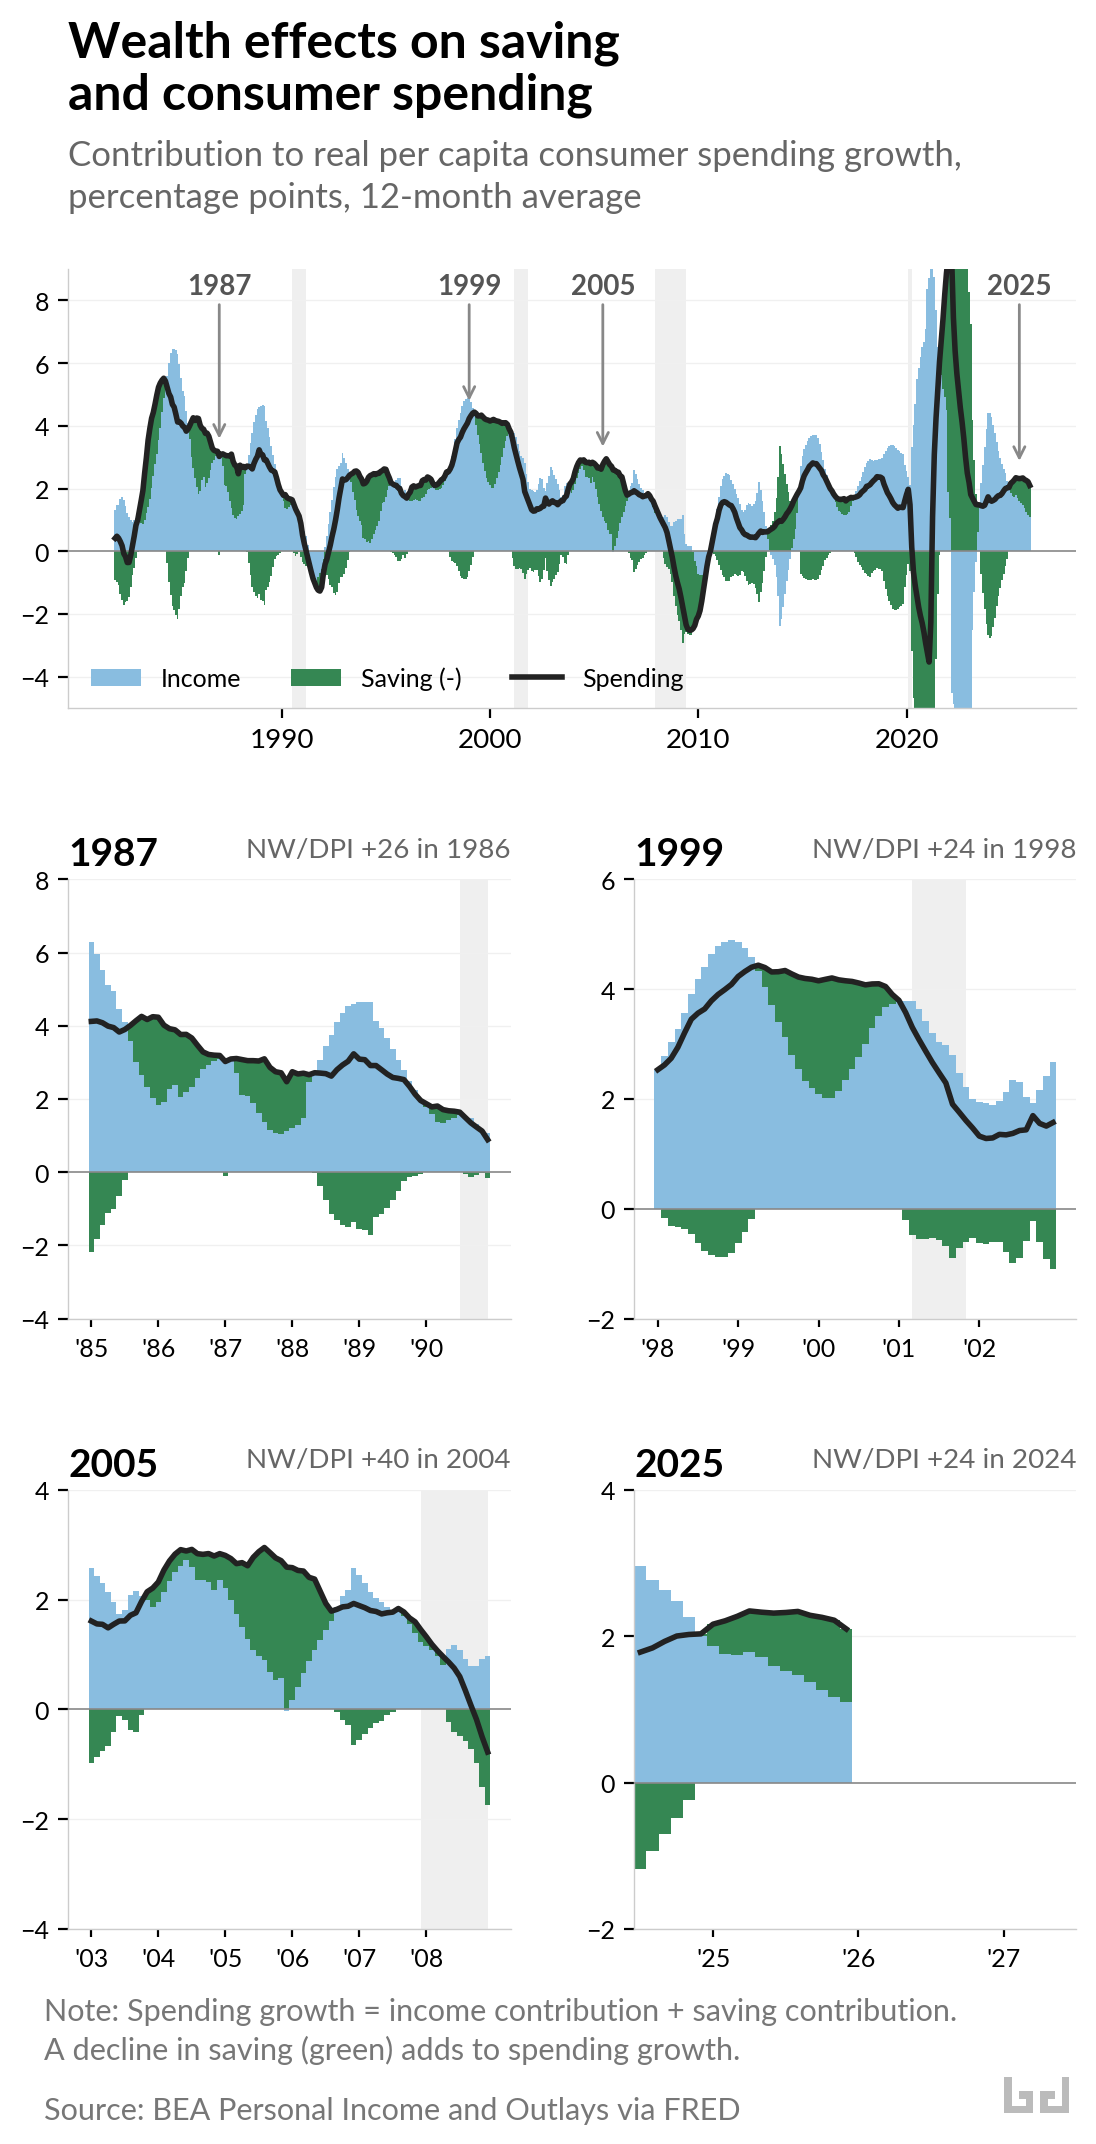
A note on method: the standard framing is that people decide how much to save and spend the rest. This analysis reverses it — decomposing spending growth into how much came from income growth and how much came from a decline in saving. The two sum exactly. When the green bars rise above zero, spending growth is being sustained by a falling saving rate rather than rising income.
Each panel shows the same sequence. Income growth slows — the blue bars shrink — and rather than adjusting down, spending holds steady as households draw on savings or borrow more. The green bars rise to fill the gap. In the 1987 panel, income fades through the mid-1980s while saving props up spending; by 1990 both have collapsed. The 1999 panel shows the dot-com version: green bars growing for two years before the whole structure falls apart after 2000. The 2005 panel is the most extreme — saving drawdowns account for nearly all spending growth by mid-decade, and the 2008 correction is the deepest on the chart.
The 2025 panel shows the early stage of the same pattern. Income growth has narrowed and saving drawdowns are growing. This episode is still unfolding.
In each prior case, the correction that followed was amplified by the prior drawdown. Households entered the downturn with less saving cushion, so spending contracted more sharply than income alone would explain.
The current episode is early but the conditions are in place. Market income — what people are paid before taxes and government transfers — turned negative in December 2025, something that has rarely happened outside of recessions. Job growth, a major component of total income growth, has stalled. The saving rate, at 3.6 percent, is nearly half its 40-year average. Both signals point the same direction: spending growth is running on a shrinking cushion. And when income does recover, it will need to outpace spending long enough to rebuild the buffer that has already been drawn down.