Labor MarketPolicy
Out of Work for Childcare in the US
Families want different arrangements when they have young children. Some want a parent home with the kids; some want both parents in paid work. What’s available to them depends on what the country has built for parents.
In the US, what’s been built leaves many parents home with the kids. About 3.6 percent of working-age adults are out of work for childcare, roughly 7 million people. Another roughly 700,000 say they would take a job if they could, bringing the share to about 4 percent. More than nine in ten are women. Right now, more people are out of the workforce for childcare than there are unemployed. So who are they, and why are they home?
Forced out
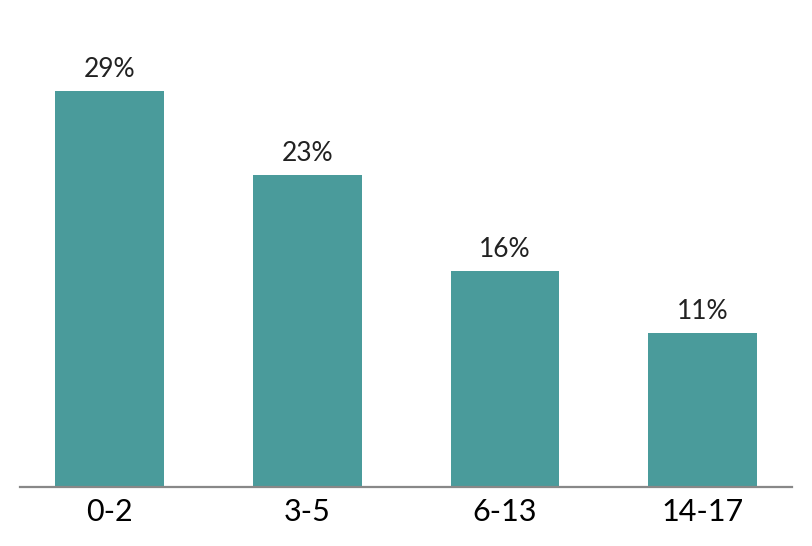
The share out of work for childcare peaks when the youngest child is an infant or toddler and falls sharply as kids age. About 29 percent of women with a youngest child under 3 are out of work for childcare, compared with 11 percent when the youngest is 14 to 17 (see chart 1). Infants and toddlers need continuous care, and the US funds essentially no public infant-care system.
Nearly a third of women with infants are out of work for childcare
Mothers 20-64, by age of youngest own child
With a young child at home, two failures push parents out of paid work: leave runs out, and care costs more than the household can pay. The median mother takes 7.2 weeks of parental leave in the US; the median father takes 3 days. Once leave ends, center-based infant care costs about $15,000 a year per child. The parent who took the longer leave is the one who stays home. The “opting out” framing in the popular press treats this as a preference, but it misses the constraint: leaving is what happens when nothing else works, not what a family does when paths are open. Most of what gets called opting out is being pushed out.
Poorer, and it sticks
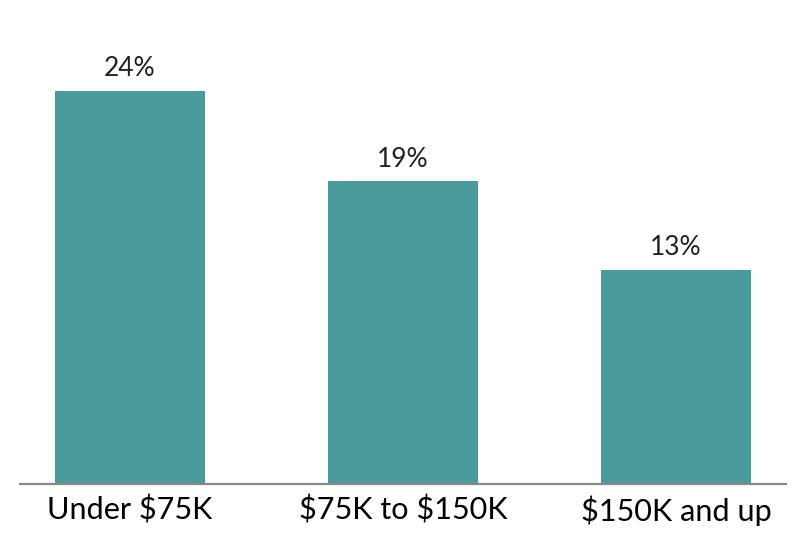
Being pushed out is costly. The share out of work for childcare falls steeply as family income rises. About 24 percent of mothers in households below $75,000 are out of work for childcare, 19 percent in the $75,000 to $150,000 range, and 13 percent in those above $150,000 (see chart 2). The income gradient is mechanical: when a parent leaves paid work for childcare, family income falls, which puts the household in a lower bracket by definition. Higher-income families largely stay in paid work because they can buy their way around the cost by paying for private care. But the cost still shapes how much they work, often pushing them past what they would want if care were cheaper, with less time with the kids as a result.
Lower-income mothers are out of work for childcare at nearly twice the rate
Mothers 20-64, by family income
Among families home for childcare, about 22 percent live below the poverty line, roughly twice the rate for working-age adults overall (about 11 percent). And the cost compounds. Researchers tracking decades of US administrative records find the earnings gap between mothers who leave paid work and mothers who stay grows over time rather than fading. Most of the loss comes from the years out of paid work themselves: wages and savings keep rising for those who stayed, and the parent out of work falls further behind each year. A woman out for one year is paid about 39 percent less per year than one who stayed; five years out costs about 19 percent of lifetime earnings. For a mother who leaves in her thirties and never fully returns, the loss runs into decades of lower pay and smaller retirement savings.
Where the option exists
Between 1999 and 2026, in states that adopted universal public pre-K, the share of mothers of four-year-olds in paid work grew about nine percentage points more than in states that did not. For mothers of school-age children, the same comparison is flat, which points at the program itself. Where the option appeared, mothers took it; what looked like a preference was the absence of an option.
For families forced out, the lever is public childcare: a funded, universal system that lets the parent return to paid work when they want to. Public childcare is extra hands, not a replacement; the parent is still the parent, and society helps cover the daytime hours of care a family would otherwise have to find or afford. Some countries, including Finland, also pay a home-care allowance: a direct payment to the parent who stays home with young children, making “stay home” a real paid option rather than a slide into poverty.
In countries that fund both public childcare and a home-care allowance, families sort themselves across both arrangements. For families home with the kids, the trap is being out of work; for families paying for care, the trap is working more than they would want, with less time together. Right now there is no choice, only the trap.
Appendix: composition of the group
The table below shows who is out of work for childcare, by sex, parent age, age of youngest child, education, number of children, and family income. Counts are monthly averages in thousands. Share of group is each row’s share of the total. Out-of-work share is the rate within that subgroup who are out of work for childcare. Source: CPS Jan-Apr 2026, age 20-64. Family income measured at first survey month for consistent 2025-income reference.
| Subgroup | People (thousands) | Share of group | Out-of-work share |
|---|---|---|---|
| All out of work for childcare | 6,896 | 100.0% | 3.58% |
| By sex | |||
| Men | 394 | 5.7% | 0.42% |
| Women | 6,502 | 94.3% | 6.62% |
| By parent age | |||
| 20-29 | 1,324 | 19.2% | 2.92% |
| 30-39 | 2,878 | 41.7% | 6.34% |
| 40-49 | 2,146 | 31.1% | 5.07% |
| 50-64 | 548 | 8.0% | 0.92% |
| By age of youngest own child | |||
| Youngest 0-2 | 2,424 | 35.1% | 16.41% |
| Youngest 3-5 | 1,471 | 21.3% | 13.48% |
| Youngest 6-13 | 2,293 | 33.3% | 9.23% |
| Youngest 14-17 | 708 | 10.3% | 6.61% |
| By education | |||
| Bachelor's degree or more | 2,551 | 37.0% | 3.20% |
| Less than bachelor's | 4,345 | 63.0% | 3.84% |
| By number of own children | |||
| 2 or more | 4,480 | 65.0% | 12.86% |
| 1 | 2,416 | 35.0% | 9.14% |
| By family income | |||
| $150,000 or more | 1,246 | 19.7% | 2.20% |
| Under $150,000 | 5,068 | 80.3% | 3.70% |