
Labor Market
Remote Work’s Slow Burn
Six years after the pandemic sent office workers home, remote work is no longer a disruption. It’s infrastructure. Nearly a quarter of the workforce now works remotely for at least part of the week, and more than a third of jobs have the potential to be done at least partially remotely, suggesting room for further expansion.
Despite untapped potential, recent data show remote work trends stabilizing. Likewise, related trends in commercial office space (vacancy rates, CMBS default rates) appear to have peaked. As the contours of post-pandemic remote work come into focus, businesses affected by the change are adjusting. How this adjustment plays out will have important consequences for US productivity.
Recent developments
In October 2022, the Current Population Survey added questions about telework, asking whether workers telework and how many hours per week. Similarly, researchers have identified tasks that can be completed remotely and which occupations feature them. Combining occupation data from O*NET with the CPS shows how many workers could potentially work remotely.
These data show around 10 percent of workers are full-time remote, a rate that has been fairly steady since 2022. In addition, a growing number of workers are in hybrid arrangements, working remotely for part of the workweek. Hybrid workers increased from around 8 percent of the workforce in late 2022 to about 12 percent in 2025.
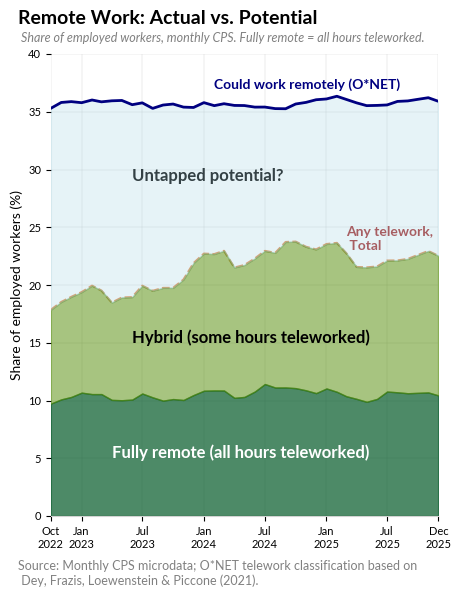
Altogether, about 22.5 percent of workers are at least partially working remotely in 2025. Based on the tasks typical for their occupations, an additional 13 percent of the workforce could potentially adopt some remote work. These trends are summarized in the chart above.
The geography of remote work
How is remote work distributed across the country, and how has that changed? To answer this, I split the US into 70 geographic zones (major metro areas and state-level regions) and calculated remote work intensity in each, measured as the share of total hours worked remotely.
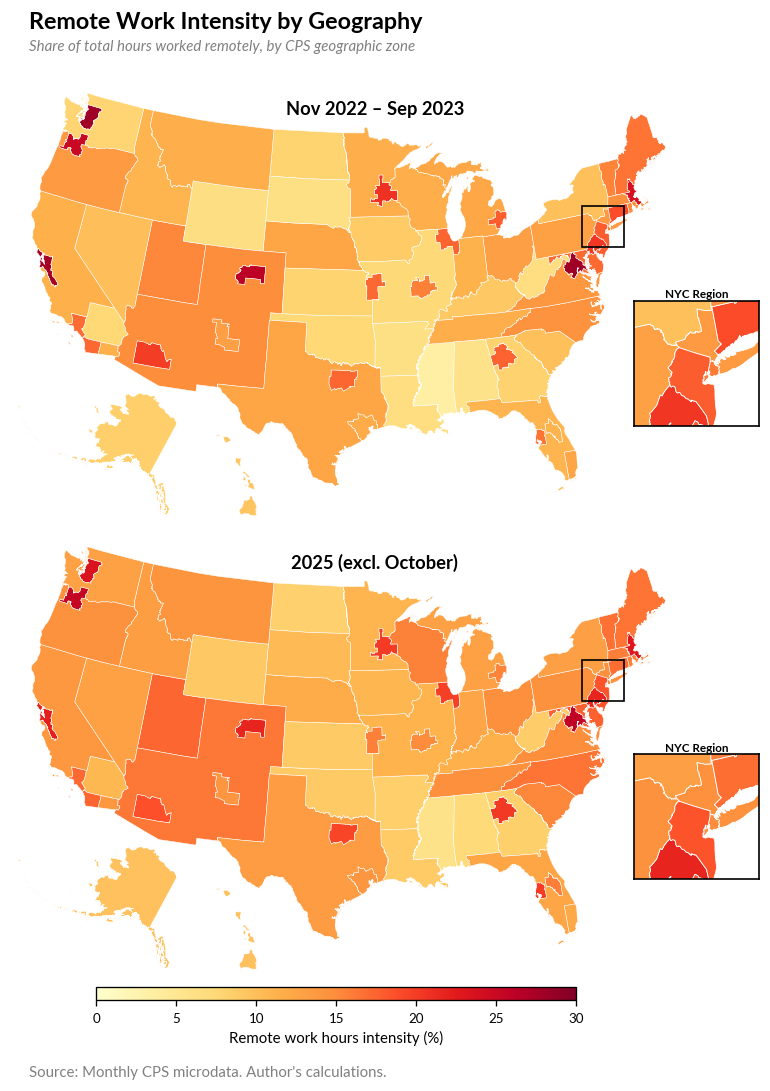
In the early period (November 2022 through September 2023), remote work was heavily concentrated in a handful of tech-heavy metros. Washington, DC led at 28 percent, followed by Seattle (27.9%), the Bay Area (27.7%), Denver (26.2%), and Portland (25.0%). At the other end, Mississippi (3.5%), Alabama (5.8%), and Arkansas (6.3%) had the lowest remote work intensity.
By 2025, the picture had shifted notably. The most remote-intensive metros saw significant declines. The Bay Area dropped 5.6 percentage points, Seattle and Denver each fell 4.5 points, and DC dipped 2.1 points. Meanwhile, growth metros like Tampa (+3.7 points), Atlanta (+2.7 points), and Dallas (+2.0 points) saw meaningful increases. Even many rural states gained ground: Wyoming (+2.6 points), Mississippi (+2.4 points), and several others moved up by more than 2 points.

The result is convergence. Remote work is spreading outward from the early-adoption tech hubs into a broader set of metro areas and, to a lesser extent, rural regions. Some of this reflects return-to-office mandates at large tech firms, and some likely reflects remote workers relocating to lower-cost metros. But the broad pattern suggests remote work is becoming a more normal feature of employment across the economy rather than a quirk of a few coastal cities.
Productivity: a long lag
Though the shift to remote work is a large change affecting many parts of the economy, measurement issues delay how it shows up in productivity data. We measure productivity growth by asking employers how much they produce and how many hours of labor they buy. When workers produce more per hour, this counts as productivity growth.
But commute times were never counted in hours worked, so reducing commutes doesn’t directly register. Likewise, firms can now produce more output per square foot of office space, but our built environment takes a long time to change. Vacant offices still get counted the same way as occupied ones in the productivity measures.
What does count is changes in how much workers produce during their paid hours. There’s some disagreement over whether remote work makes individual workers more or less productive, but the evidence suggests the effect is small and, for hybrid workers at least, slightly positive.
Eventually, the broader changes from remote work will show up in productivity data. The Federal Reserve estimated this process takes roughly six years, meaning we should start to see early results in the next few years. The mechanism is the built environment adjusting to use fewer inputs per unit of output. Converting vacant offices to housing, for example, removes idle capital from the production process.
In theory, this reorganization could be highly efficient: converting office buildings near transit into housing, reducing commuting, freeing up road capacity. But it could also go the other way. If remote work mainly lets people spread out into exurban and rural areas, the result could be more driving, more sprawl, and more resources spent on errands and logistics. How it shakes out is an open question.
There’s also a funny side effect: remote work is something of a return to cottage industry. We’ve replaced some centralized offices with decentralized offices in people’s homes, effectively shifting office space from business accounts to residential accounts. The typical household now needs more square footage, all else equal. And during future downturns, workers will carry a home office on their back while firms avoid this cost through layoffs.
Are remote industries getting more efficient?
While the full productivity effects are years away, we can look at early industry-level evidence. One approach is to compare how efficiently industries use intermediate inputs and whether this relates to remote work intensity. A BLS analysis found that industries with larger increases in remote work saw slower growth in nonlabor costs per unit of output, especially costs tied to office buildings.
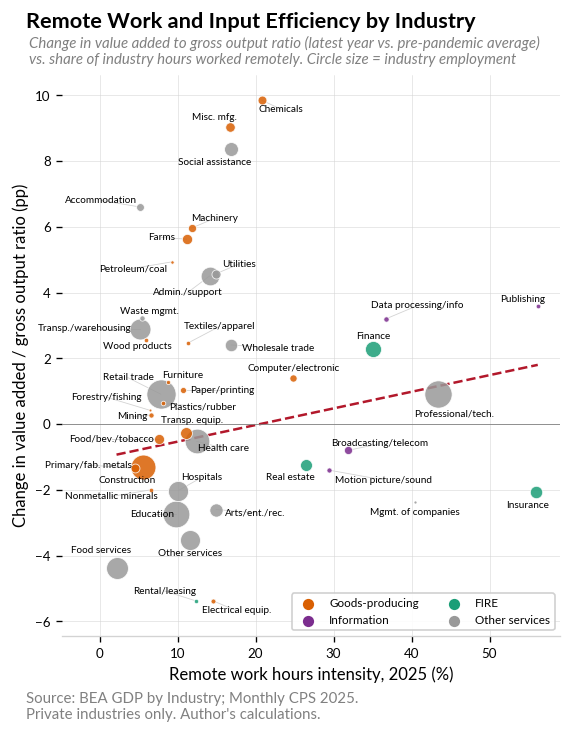
The chart above plots each industry’s remote work hours intensity (horizontal axis) against the change in its ratio of value added to gross output since 2017-2019 (vertical axis). A rising ratio means an industry is using fewer intermediate inputs per dollar of output. Bubble sizes reflect employment share.
The trend line tilts slightly positive, but the relationship is weak, and it’s hard to separate remote work effects from other structural shifts. This is what we might expect if the effects are still emerging, but it’s far from conclusive. If the Fed’s six-year lag estimate is right, we are still early in the process.
What about the office crash?
One question that comes up frequently: will the commercial real estate downturn in office space cause broader economic damage? The vacancy rate headlines are striking, and office CMBS delinquencies have risen.
I used to think this was a serious risk, but looking at the data, I’ve become less concerned. The reason is straightforward: we just aren’t building that many offices anymore, and the sector has been through repeated boom-bust cycles, each weaker than the last.
Using BEA Fixed Assets data on real net capital stock, the pattern is clear. Office construction peaked at 8.8 percent annual growth during the S&L boom around 1985. The dot-com era peak was only 3.9 percent growth around 2000. Then the GFC hit office construction hard enough that net investment (gross investment minus depreciation) went negative for five straight years, from 2009 through 2013. The office stock was literally shrinking. By the time the sector recovered, office capital heading into the pandemic was growing at just 1.7 percent per year. Each cycle left the office sector smaller relative to the rest of the economy.
Meanwhile, the economy has been reallocating capital toward intangibles for decades. Since 2017, the real net stock of software has grown 96 percent while the office stock has grown just 7 percent. The economy simply doesn’t depend on office construction the way it once did. The current office adjustment is real, but the macro drag is far smaller than the vacancy headlines suggest, especially since other categories like data center construction are booming.
The Solow paradox, again
Remote work has stabilized as a permanent feature of the US economy, with nearly a quarter of workers teleworking at least part of the week. The geography is shifting, spreading from early-adoption tech hubs into a broader set of metros and even rural areas. And the office sector is adjusting, but from such a diminished base that the macroeconomic risks are manageable.
The bigger open question is productivity. There’s a parallel here to the Solow paradox of the 1980s: “you can see the computer age everywhere but in the productivity statistics.” We can see remote work everywhere, but its effects on measured productivity are still largely invisible, delayed by the slow process of reorganizing the built environment. Early industry-level results are consistent with modest efficiency gains, but the full picture won’t emerge for several more years.
How this plays out will depend on thousands of local decisions. Do we convert vacant office buildings near transit into housing, allowing denser and more efficient living arrangements? Or does remote work mainly enable sprawl, more workers in Montana ordering DoorDash for lunch? The optimistic and pessimistic versions of remote work’s long-run impact hinge on these choices, and the answer will probably be some of both. We’re still early.