Policy
To Speed Up Buses, Change the Streets
In June 2025, WMATA launched the Better Bus Network Redesign, the first overhaul of the DC region’s bus network in 50 years. The redesign eliminated 527 stops, consolidated 185 routes into 126, and promised faster, more frequent, and more reliable service.
Six months of data suggest a mixed outcome. The buses are more frequent. But they are slower, and fewer people are riding them.
Three findings
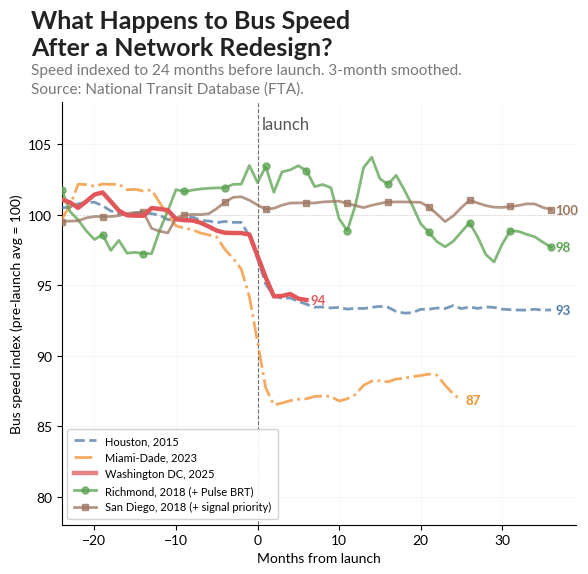
1. Bus speeds fell 5 percent, with no sign of recovery. Average Metrobus operating speed (revenue miles divided by revenue hours) dropped from 9.8 mph to 9.3 mph the month the redesign launched. December 2025, the most recent data available, is even lower at 9.28 mph. WMATA’s scheduled vehicle hours grew 11 percent while scheduled miles grew only 7.6 percent. More than half the speed drop comes from schedule padding, building in extra running time to improve on-time performance (which it did). The rest reflects a network redesigned on paper but deployed onto unchanged streets.
2. This is the norm, not the exception. Using National Transit Database data, I compared bus speed before and after network redesigns at 14 U.S. agencies that launched route overhauls between 2015 and 2025. Twelve of 14 saw speeds decline, a pattern that holds after accounting for national speed trends. Houston dropped 5.6 percent in 2015 and remains about 3.5 percent below its pre-redesign speed a decade later. Miami-Dade fell 11.5 percent after its 2023 redesign. The only two cities that improved were Richmond, which launched its Pulse BRT line alongside the redesign, and San Diego, which added transit signal priority to key routes at the same time.
3. Slower buses cost real money. The 5 percent speed decline means WMATA needs roughly 250,000 more revenue hours per year to cover the same miles. At the agency’s budgeted cost of about $160 per revenue hour in personnel, that is on the order of $40 million a year. Meanwhile, bus ridership fell 8 percent year-over-year in the second half of 2025, even as Metrorail ridership grew 12 percent over the same period. Each bus in the fleet is working harder but carrying fewer people.
What would actually work
WMATA’s own board presentations answer this question: “Bus priority increases speeds by >10%” and “most peers have at least twice as many miles of bus lanes.” Route A1X, which runs in dedicated right-of-way, hits 83 percent on-time performance, well above the system average. But the region has only 29 directional miles of bus lanes.
The redesign delivered real benefits: more frequent routes, shorter waits, a simpler network. WMATA did its part. But faster buses require something WMATA can’t build alone: bus lanes, signal priority, and proper stop infrastructure on streets controlled by DC, Maryland, and Virginia. The lesson from a decade of U.S. bus redesigns is that route changes and street changes work best together. One without the other delivers half the promise.