
Policy
Defining Poverty Away
A recent piece from Seth Ackerman showed how the design of economic statistics changes the story they tell. At any point in time, US and European workers have comparable productivity. But when comparing across countries over time, the US appears to pull steadily ahead in growth. The divergence fuels a narrative of American dynamism, but it is largely a statistical artifact. Countries measure price changes in different ways, and those differences compound over time.
The main culprit in the productivity story is hedonic adjustment. The US assigns more technological progress to the price level: a TV with twice the resolution at the same price registers as deflation. This lowers measured inflation, which inflates apparent productivity gains relative to countries that assign less technological progress to the price level.
The productivity story has a direct parallel in how the US defines poverty. The official poverty line is adjusted each year only by the CPI, so it never rises with living standards — only with prices. Hedonic adjustment makes it worse, putting technological progress into the price index and pulling the line even lower.
Other wealthy countries avoid this entirely by setting the line relative to median income. The official US poverty line asks only whether someone is better off than a poor person in 1963. A relative line asks whether someone can participate in their current society. The first treats economic progress as something the poor have no claim to.
The poverty rate is the share of people whose household income falls below the poverty line. So where you draw the line determines how many people are in poverty. The federal poverty guidelines draw it at $33,000 for a family of four in 2026, about $690 per person per month. A relative poverty line draws it at 50% of median income — about $60,000 for the same family.
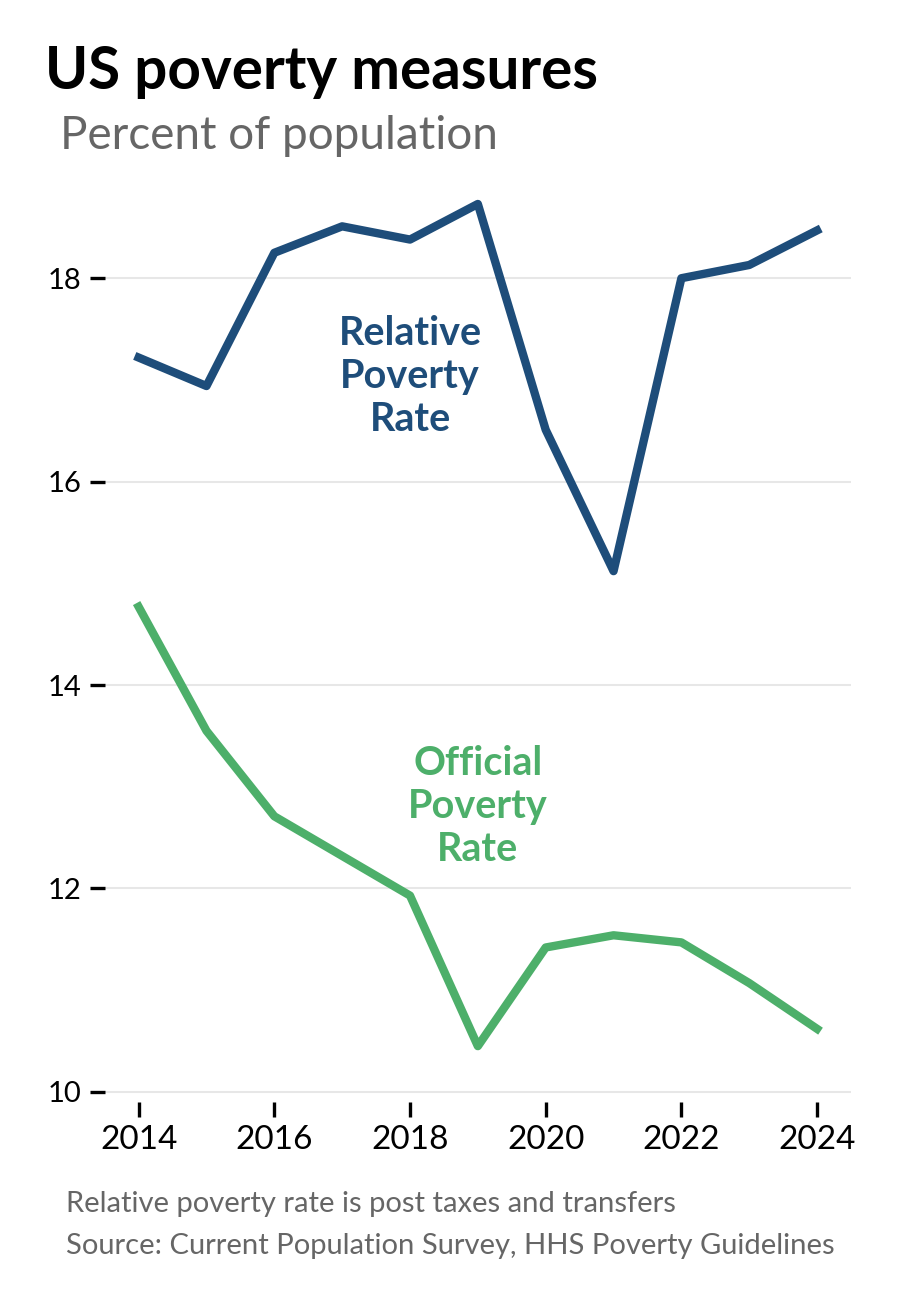
The official US poverty rate fell from 15% to 11% over the past decade, as incomes at the bottom improved. But incomes in the middle and at the top improved faster. The relative poverty rate, calculated from income after taxes and government benefits, increased over the same period. In 2021, expanded pandemic benefits briefly pushed the relative measure down to 15%. It snapped back when those programs expired.
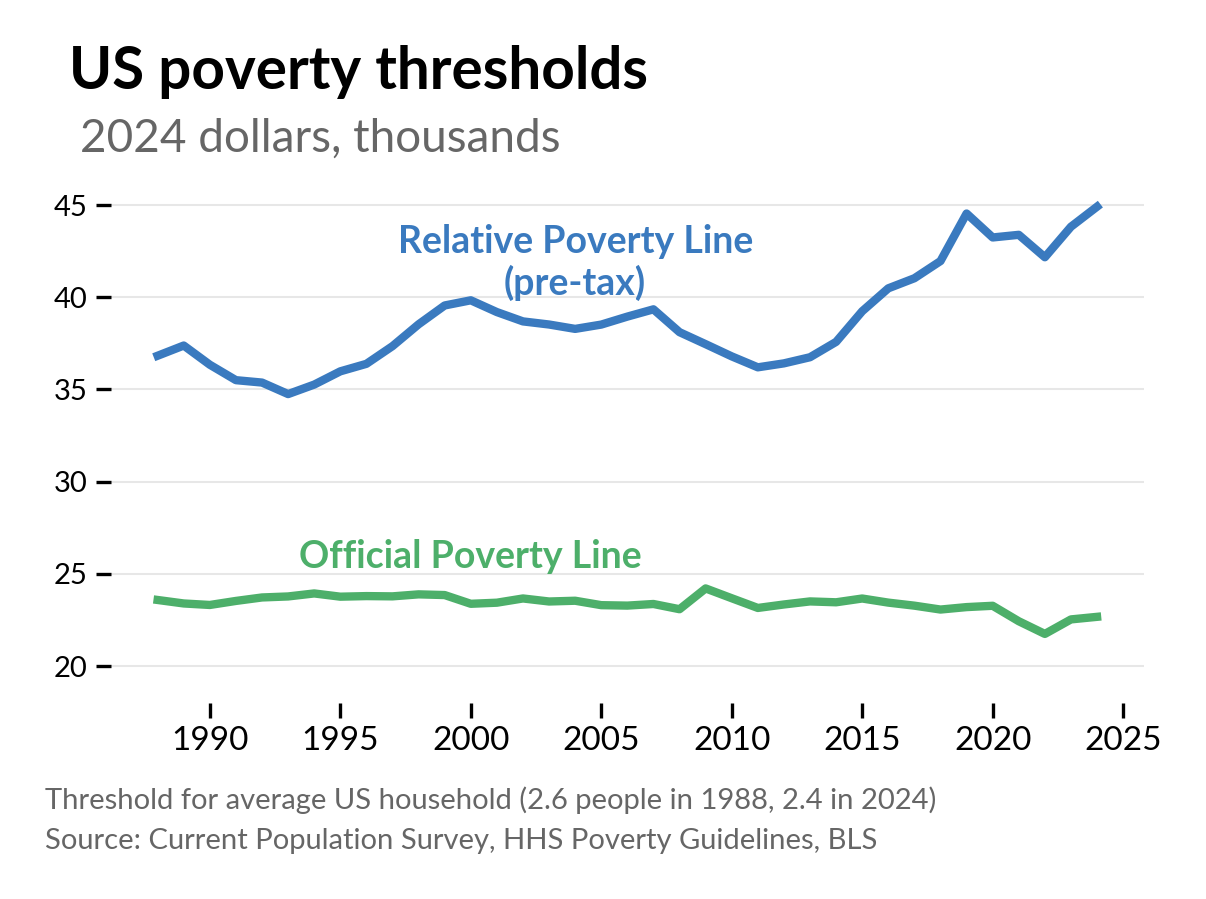
In 2024, the official poverty line for the average US household (household size of 2.4 people) is $23,000. This figure is adjusted each year by the CPI, so it changes very little, in real terms, over time. The small decrease comes from average household size shrinking over the period. The relative poverty line, when calculated as 50% of median pre-tax income, is about $45,000 for the average US household in 2024. Since 1988, the official line has fallen from two-thirds of the relative line to half.
When the official federal poverty line was first set in 1963, it was about 50% of median family income. In 1969, a federal committee froze it to price changes only. Today it sits at 29%. Gordon Fisher at HHS documented that prior to 1969, poverty lines in the US, UK, Canada, and Australia had always risen in real terms. The freeze was a break from all prior practice. Poverty was redefined in a way that caused it to fall over time.
Shawn Fremstad has covered this topic very well. As he explains, “the dominant framework for measuring poverty in the United States has become an ideologically conservative one.” The cost of participating in society continues to climb, while the official poverty line is designed to stay the same, effectively defining poverty away over time. The gap has grown large. In a 2023 Gallup survey, Americans said a family of four needs $85,000 to get by. The official poverty line that year was $30,000.
The Gallup World Poll asks people in different countries to evaluate their lives by placing themselves on a ladder where the top rung is the best possible life for them. Nobody answers by comparing themselves to 1963. The US poverty line does. The US should measure poverty the way the rest of the world does — against current living standards, not a line frozen sixty years ago.