Labor MarketPolicyWages & Income
The Wage Data Went Dark at Exactly the Wrong Time
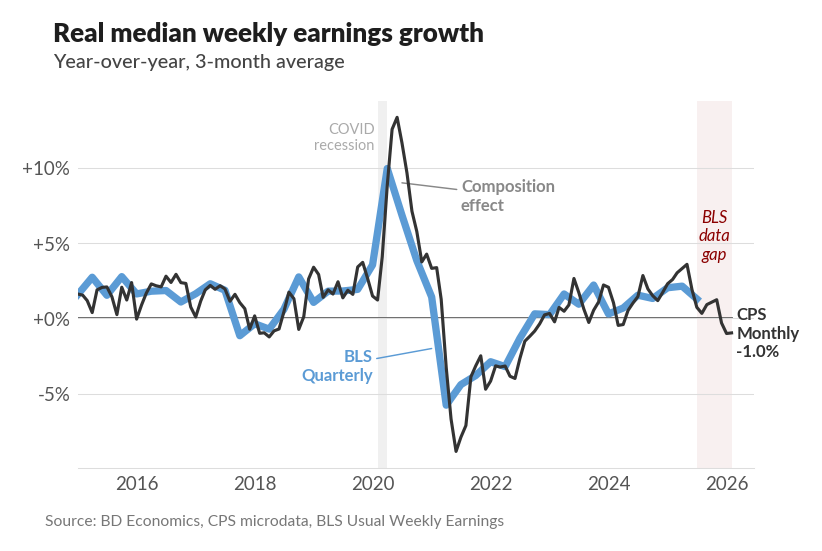
The government shutdown meant no October CPS was collected. Without it, the BLS couldn’t publish its Usual Weekly Earnings series for the fourth quarter of 2025. That’s a six-month hole in the official wage data.
Using the same CPS microdata the BLS relies on, we can fill the gap. The BD Economics measure tracks the official series closely when both are available (Chart 1). What it shows for the missing period: real median weekly earnings growth fell to -1.0% year-over-year by February 2026.
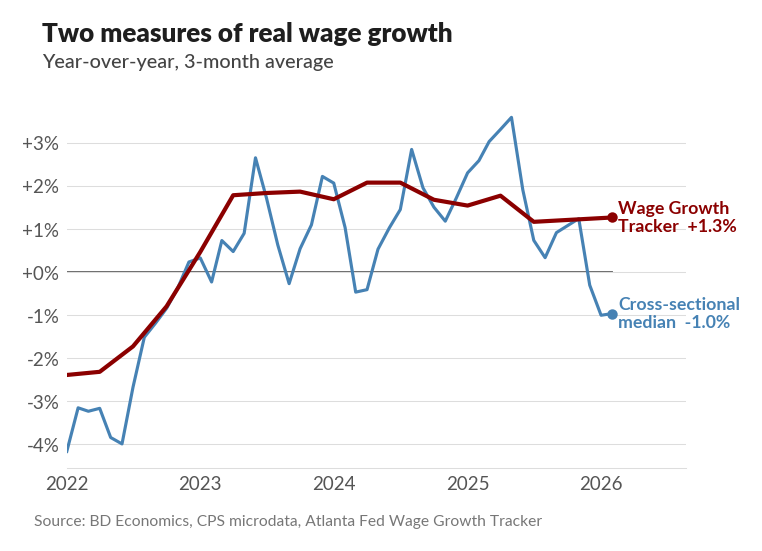
But here is where it gets interesting. The Atlanta Fed’s Wage Growth Tracker, which follows the same individuals over time rather than taking a snapshot of whoever happens to be working, shows real wage growth of +1.3% over the same period (Chart 2). Workers who kept their jobs are doing fine. The 2.2 percentage point gap between the two measures is not a contradiction. It is a composition effect: the mix of who is working changed.
The Wage Growth Tracker only captures people who report wages in both of their CPS rotation appearances, twelve months apart — and the CPS response rate is now lower than during the pandemic, making that matched sample increasingly selective. If you lose your job between measurements, you disappear from the tracker. That is the point of the design. It filters out composition. But it also means the tracker has nothing to say about the people who left.
We can say something about them. By matching CPS individuals across their rotation groups, we can identify who dropped out of the wage sample and what they were paid before they left. Here is what the dropout profile looks like compared to the 2023-2024 baseline:
| 2023-2024 average |
2025 Q4 | |
|---|---|---|
| Survey Retention rate | 66.5% | 60.3% |
| Dropout median wage | $1,072 | $1,146 |
| Stayer median wage | $1,256 | $1,296 |
| Federal dropout wage | $1,386 | $1,716 |
The share of wage workers still reporting pay twelve months later fell to 60%, matching COVID-era lows. The median wage of the people who left jumped to $1,146 per week, roughly $75 above baseline. Federal workers who left were paid $1,716 per week. The people leaving the wage sample are not marginal workers. They sit above the median.
The composition effect in wage data usually runs one direction: in a downturn, lower-paid workers lose hours or jobs first, and the remaining sample looks artificially richer. This time it is running the other way. Higher-paid workers are leaving, pulling the cross-sectional median down while individual wage growth holds steady. The wage data looks worse than individual experience because of who is being cut.
This is the statistical footprint of a specific policy. About 330,000 people left the federal workforce in 2025 while only 110,000 were hired. Workers with 30 or more years of experience saw a 33% net decrease. The most experienced, highest-paid public workers left at the highest rates. Meanwhile, scientists are leaving the country, European Research Council applications from US-based researchers nearly tripled, and the Pentagon cut ties with MIT and Carnegie Mellon in favor of Liberty University and Hillsdale.
Wage composition effects are normally a measurement nuisance that economists adjust for. This one is different. It is not cyclical churn that will reverse when demand recovers. The positions were abolished — not for fraud or waste, but ideology. The expertise walked out the door. The wage data registered it as a composition shift. The country will register it as 180-minute Social Security callback times, unfilled nuclear security posts, and research labs relocating to Aachen and Marseille.
The official data went dark for six months. What it missed was not a recession. It was a restructuring of who employs skilled workers and on what terms. The composition data is the receipt.