Housing & Demographics
Where is Housing Being Built? (2026 update)
Where people move and where housing gets built tend to go together, and both are concentrated in the US south even as housing prices remain well above their pre-pandemic levels in most areas. Of the 1.8 million people added to the US from July 2024 to July 2025, 1.2 million were in the south, and most new housing supply has been added there as well.
As one result of these changes, California and states in the northeast region will continue to lose congressional seats, and states in the south will add them. In discussions of that apportionment shift, some have pointed out that most of the new housing is also being built there. It only follows that the south will have the population growth. Cause and effect here aren’t clear-cut, but this seems reasonable.
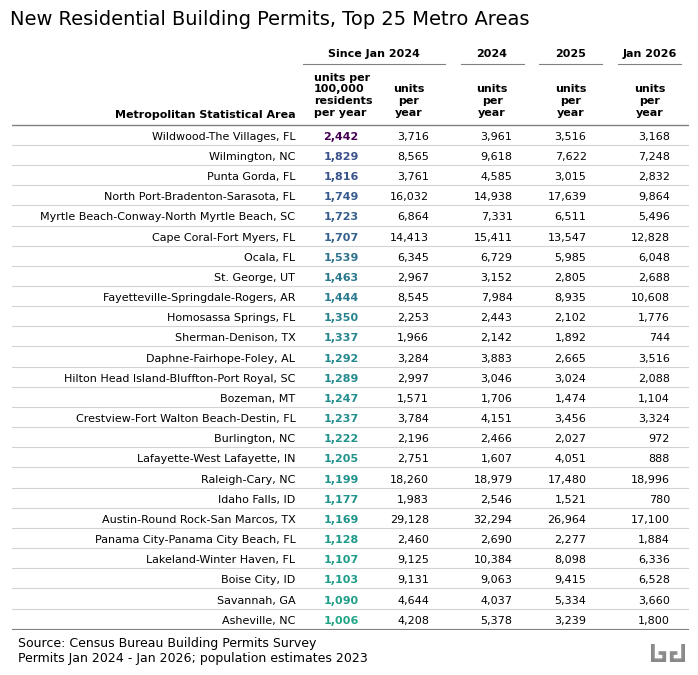
Each month the Census Bureau reports building permits issued in major metro areas. Using these reports, I’ve divided new housing units permitted in each metro area each year by the resident population. The goal is to identify where new housing is likely to grow fastest relative to population. The results are mapped below for the period from January 2024 through January 2026.
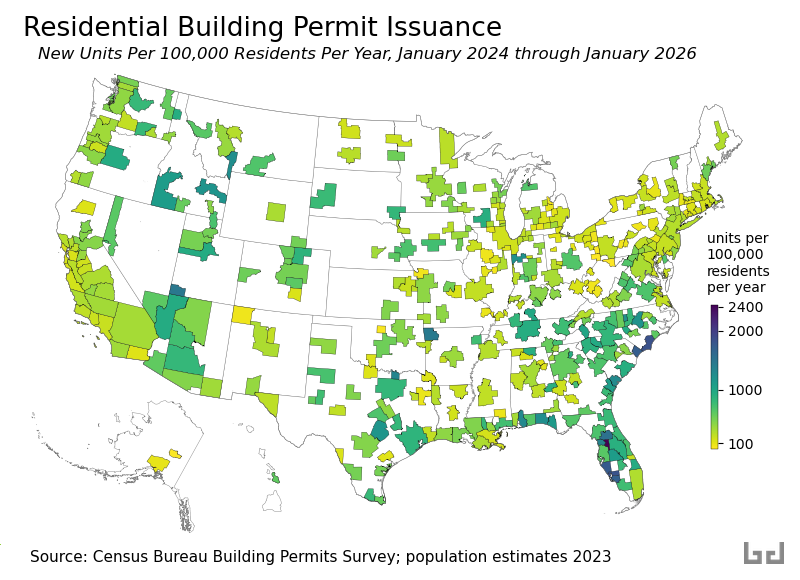
Not every permit ends up being built, but the map gives a decent idea of where growth is likely over the coming year. Since the last version of this post, the overall pace of permit issuance has slowed by roughly 10 percent, with nearly all of the decline concentrated in apartment buildings. Higher interest rates have made large apartment projects harder to finance.
The following table shows the top 25 metros by units issued per resident per year. The highest rate is again in the smaller- and mid-sized metro areas of central and southwest Florida, where Wildwood–The Villages, a large retirement community, leads the nation at about 2,440 permits per 100,000 residents per year. The biggest shift from the 2023 version of this post is in Austin, Texas: after leading the large-metro ranks last time, Austin has slipped to 20th. Its early-2020s construction boom appears to have caught up with demand, and the pace of new permits has since eased. Raleigh, North Carolina is now the fastest-building large metro, fitting the pattern: where the south builds, the south grows.