Trade & International
US-China Trade: Decoupling?
In recent US data, merchandise imports from China claim a much smaller share of the overall economy than they did in 2015. At first glance, it may appear that increased tariffs are causing a decoupling of the US and Chinese economies. Importantly, however, these trends are not present in the data reported by China. Research shows invoice avoidance is causing under-reporting in the US data. In a scenario where the reporting gap between the US and China remains constant after tariffs were put in place, US-China trade was as strong as ever during 2021 and early 2022. Further, the slowdown in trade since 2022 seems to stem from lower US goods demand.
The “Decoupling” in US Reported Goods Trade with China
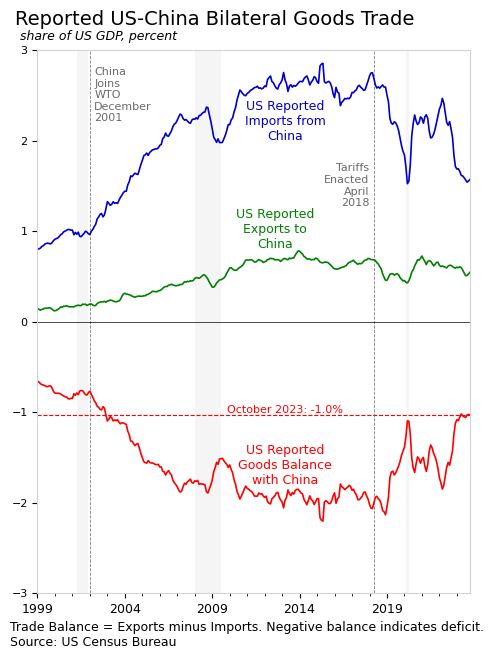
Data from the US Census Bureau suggest a steep decline in imports from China following the implementation of tariffs by the Trump administration in April 2018 (see chart below). Relative to the size of the overall economy, the merchandise trade deficit with China was cut in half, according to US reports, falling from over two percent of GDP in 2015 to one percent in October 2023. Incredibly, these data show a goods trade deficit that is nearly as small as it was when China joined the WTO in 2001. The decrease in US-reported trade with China is sometimes described as a “decoupling” between the two economies, though this is not actually what is happening.
China Data Show No Decoupling
The US reports imports from China, and China also reports exports to the US. This double counting is particularly useful in cases where one party has an incentive to avoid reporting. I’ll refer to the difference between what two countries report for the same flow of trade as the “reporting gap.” Prior to 2018, the reporting gap between the US and China was relatively constant; The US reported imports from China that were consistently 0.4 GDP percentage point above what China reported. In 2018, the reporting gap began to shrink rapidly and then reverse in 2020 (see chart below). The reporting gap has swung by a total of around 0.7 percent of GDP.
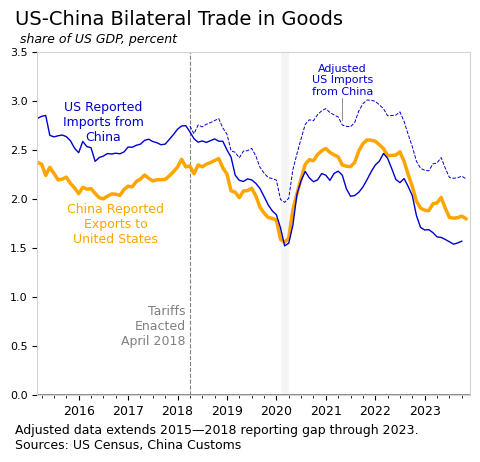
Economists at the Federal Reserve have found that the change in the US-China
reporting gap is primarily due to decreased reporting by US importers. Examples of this include invoice avoidance or the de minimus loophole. Packages valued under $800 avoid tariffs, leading to a rise in direct-to-US-consumer retail brands in China, among other effects.
In the above chart, the dashed blue line represents what US-reported imports from China would have been if the pre-tariff reporting gap had continued. The “decoupling” that appears in US-reported data in 2021 disappears completely after this simple adjustment. Indeed, US imports from China were at an all-time high, relative to GDP, in late 2021, after this adjustment.
Excess US Goods Demand
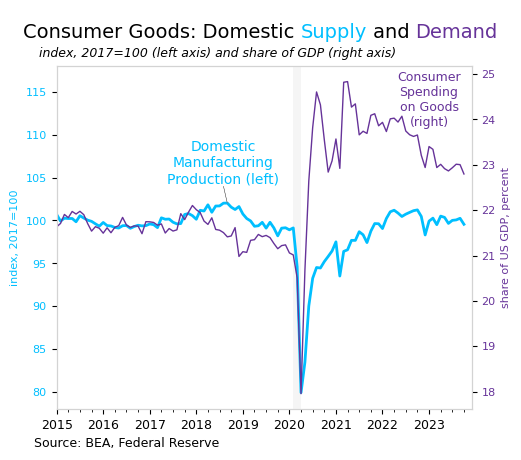
To understand why record-high imports from China in 2021 are much more plausible than the decrease in imports seen in US reports, look at the major spike in US consumer spending on goods during 2020 and 2021 (see chart below, right axis). Higher demand for consumer goods, equivalent to an increase of more than two percent of GDP, is attributed to higher household income and to the relative unavailability of services like dining and travel during the pandemic. Domestic production (left axis on chart below) was not able to keep up, so much of the “excess” demand was met by imports from other countries.
When discussing a US-China “decoupling,” researchers sometimes cite the possibility of Chinese goods flowing through another country before reaching the US. In 2021 and 2022, there was an increase in imports to the US from Vietnam and Thailand, raising speculation of re-routing from China. My sense is that many countries simply increased exports to the US during this period to help meet higher US demand. And, as we have seen, China did, as well.
The data reported by US trading partners to the IMF show that China’s trade surplus with the US had somewhat decreased even before the US COVID-19 shutdowns (see chart below). During 2015 to 2018, China’s reported trade surplus with the US averages 1.45 percent of US GDP, but the surplus falls to 1.16 percent of GDP at the start of 2020. At the peak of pandemic shutdowns in the US, China’s trade surplus falls to less than one percent of GDP, before climbing to a record-high 1.8 percent of GDP by the end of 2022. In total, China seems to have absorbed about a third of the excess US demand for goods in 2021.
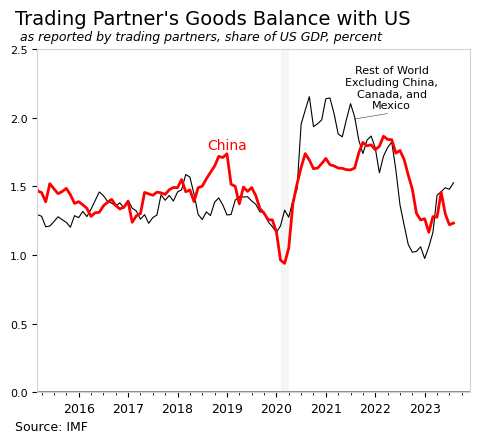
The thin black line in the chart above represents the goods trade balance with the US reported by all countries other than China, Canada, and Mexico. This set of all countries except for the big three US trading partners has a combined trade surplus with the US. If trade from China is being re-routed through other countries, this measure would capture it. The collective surplus of the “other” group had fallen to a bit under 1.2 percent of US GDP, pre-COVID, and peaked at over two percent of GDP during 2020 and 2021. By rough estimates, this group absorbed half of US excess goods demand.
Turning to more recent data, China and the rest of the world have reported smaller trade surpluses with the US as US stimulus fades and US supply chains recover. In 2022, there was a small slowdown in the US economy, and the goods trade surplus with the US reported by China and other countries fell significantly. For the “other” countries group, the drop in the trade surplus with the US during 2022 is larger than the drop during COVID, and larger than the equivalent 2022 US trade surplus decrease for China. The 2022 decrease appears to be linked to a general decline in US demand for imported goods, rather than being specific to US-China trade.
Decrease not Decoupling
While the decrease in US reported imports from China in 2020 and 2021 seems to have occurred only on paper, the decrease in 2022 is real, but not specific to China.
In hindsight, the “excess” US demand for goods in 2021 was obviously absorbed, to a large extent, by other countries. US goods manufacturing has grown little over the last 20 years and fell substantially during the pandemic. And while the pandemic limited China’s ability to meet US demand in many ways, China still managed to achieve a record goods trade surplus with the US in 2021, according to China Customs data. Contrary to US reports, China played an outsized role in supplying the US with goods during the pandemic. This should not be surprising; data suggesting otherwise should be surprising.
The picture since mid 2022 is less clear. There does seem to be a decrease in US trade with China, but the trend extends to other countries. Lower goods imports to the US since 2022 likely reflect the normalization in US consumption patterns and improvements in domestic supply chains. As such, the US-China “decoupling” narrative does not seem to hold up in the more recent data, either.