
MacroeconomicsWages & Income
Economic Divergence: The K-Shaped Economy’s Missing Story
Some economists have been highlighting a divergence in consumer spending. But the discussion is missing an important piece: the dramatic shift toward regressive taxation in 2025.
The Gap
Here’s the puzzle: labor income growth has collapsed. Real median weekly earnings, which I calculate from the monthly CPS microdata (BLS did not release Q4 2025 data) turned negative in late 2025. Workers at the middle of the distribution are earning less in inflation-adjusted terms than they were a year ago.
Market income tells the same story. Real personal income excluding transfers, what households earn from wages, investments, and business income before government payments, turned negative in November 2025. This is the first time since the pandemic that market income has contracted year-over-year.
Even aggregate labor income in the national accounts has slowed sharply, from around 3 percent growth in early 2024 to just 1.5 percent by Q3 2025.
Yet aggregate consumption has held up. How is that possible?
Dean Baker at CEPR recently noted that consumption is outrunning wages. One way to see this is by comparing labor income to consumption. In a normal economy, wages are the primary source of spending power. Comparing compensation of employees to personal consumption expenditures, the ratio shows how much of our collective spending is supported by paychecks versus other sources.
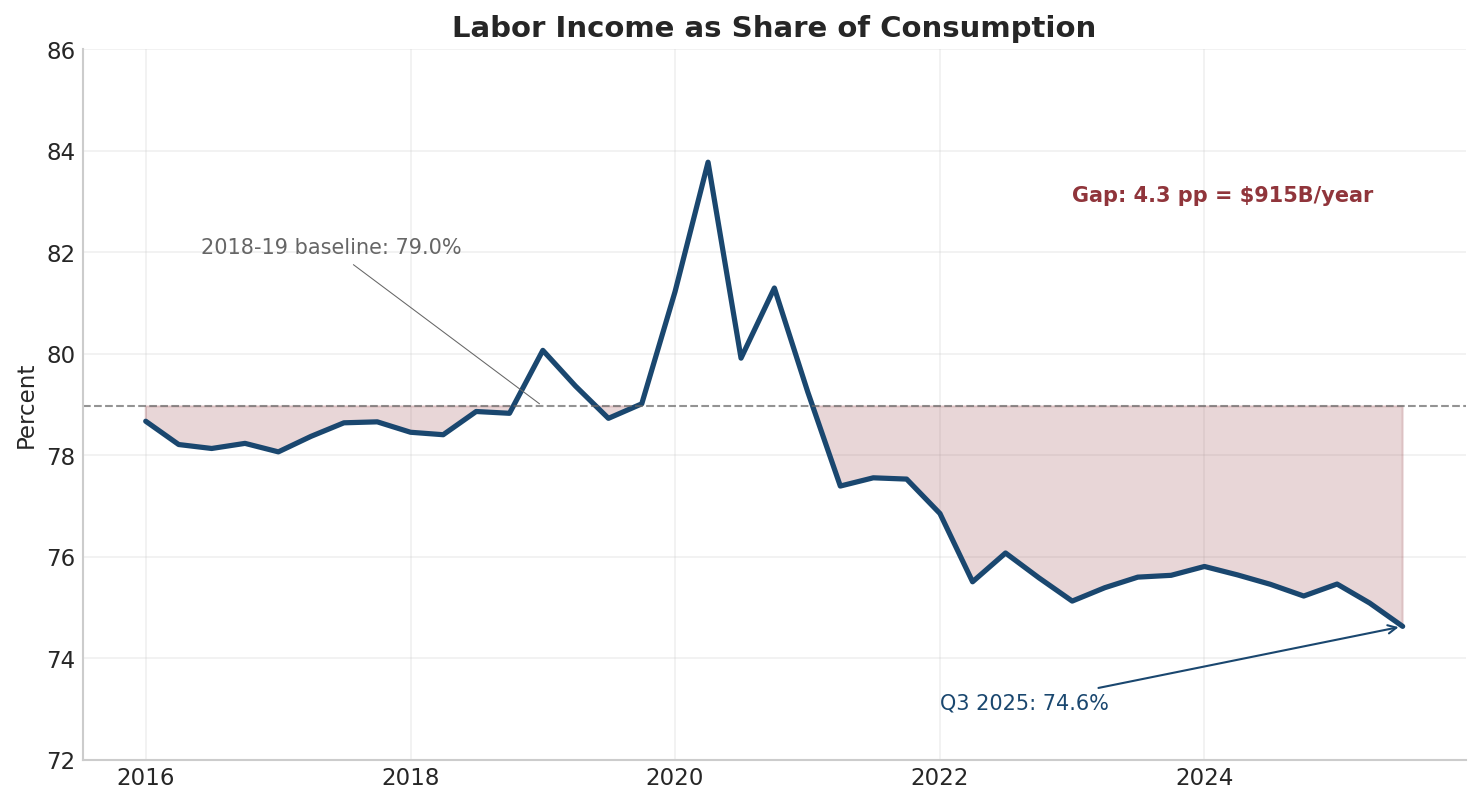
In 2018-2019, a period with a strong labor market before the pandemic distortions, this ratio averaged about 79 percent. By Q3 2025, it had fallen to 74.6 percent. That 4.4 percentage point drop represents a gap of over $900 billion annually. That’s consumption that wages alone cannot explain.
Recent survey evidence suggests where the gap is coming from. The Philadelphia Fed found that lower-income households are cutting back on spending while higher-income households are not.
This is what the K-shape looks like in the national accounts. The aggregate numbers, GDP growth, total consumption, can look fine while masking a divergence underneath. Some households maintain their spending through wealth; others face stagnation. The median worker’s earnings are already falling in real terms, even as total consumption continues to grow.
The Policy Shift
To understand what’s happening, it helps to look at what changed in 2025. One notable shift: the tax structure moved dramatically toward regressive taxation.
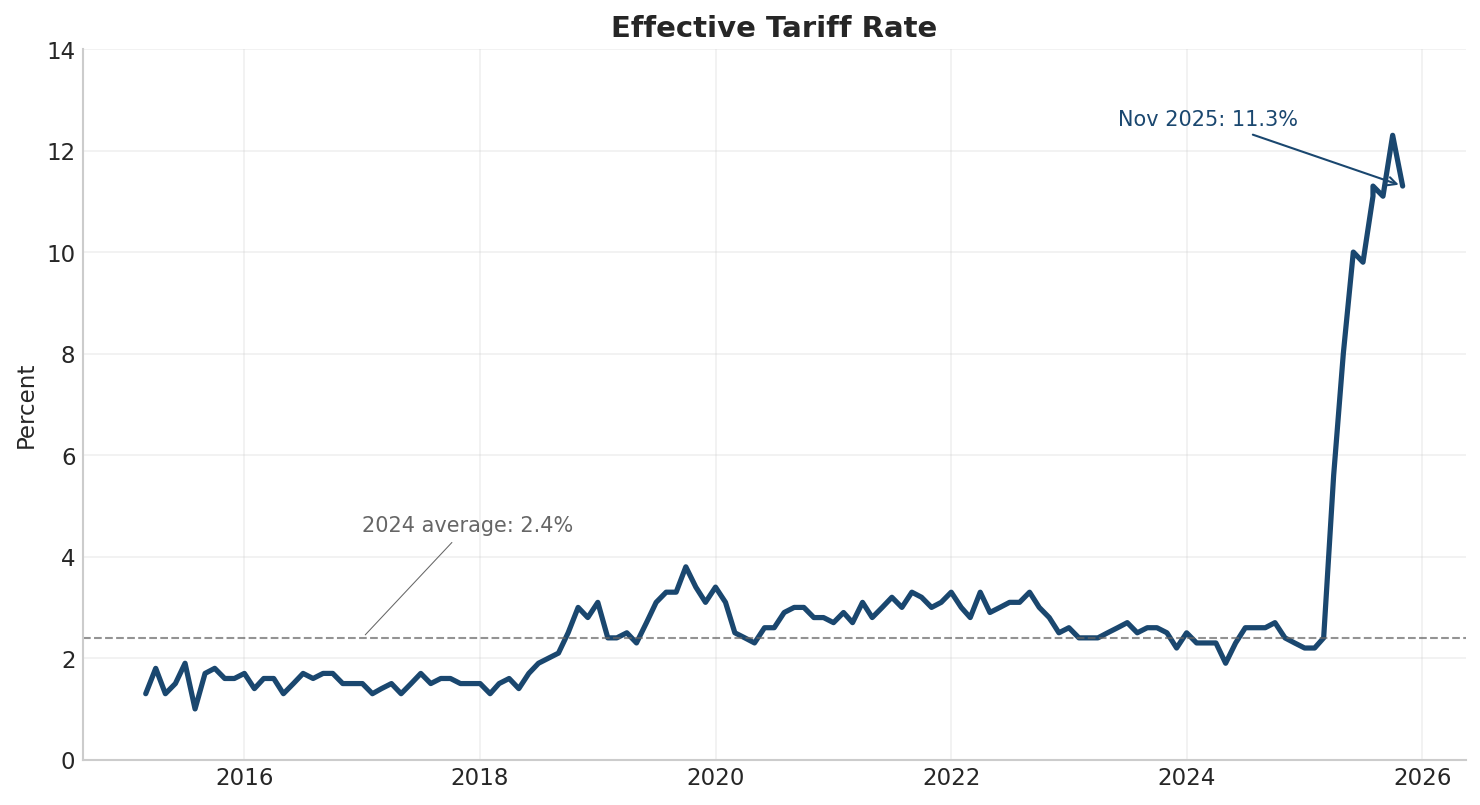
The realized effective tariff rate (actual duties collected divided by imports) quintupled, from roughly 2 percent to over 11 percent. At the same time, corporate income tax as a share of federal revenue dropped from 10 percent to under 8 percent.
Why does this matter? Because tariffs and corporate taxes fall on different people.
Corporate income taxes are broadly progressive. The CBO and Tax Policy Center both assign them primarily to shareholders, who tend to be higher-income households. Tariffs, by contrast, are consumption taxes. They raise the price of imported goods, and everyone who buys those goods pays more. But lower-income households spend a larger share of their income on goods (as opposed to services, housing, or savings), so tariffs hit them harder as a percentage of income.
The Yale Budget Lab estimates the tariff burden on the lowest income decile is roughly three times that of the highest—2.5 percent of income versus 0.8 percent.
This is a shift from progressive to regressive taxation. The gap between progressive taxes (corporate + estate) and regressive taxes (tariffs + excise) collapsed from 6.8 percentage points to just 1.7 percentage points—a 75 percent reduction in one year.
The GDI Evidence
There’s another way to see this shift: through Gross Domestic Income.
GDP measures the economy from the spending side—what we buy. GDI measures the same economy from the income side—what we earn. They should be equal in theory, and the Bureau of Economic Analysis publishes both. The GDI breakdown shows where income is going: to workers (compensation), to capital owners (profits), to government (taxes), and so on.
Before April 2025, labor compensation contributed an average of 1.5 percentage points to quarterly GDI growth. Workers were capturing a healthy share of economic expansion.
In Q2-Q3 2025, that contribution collapsed to essentially zero.
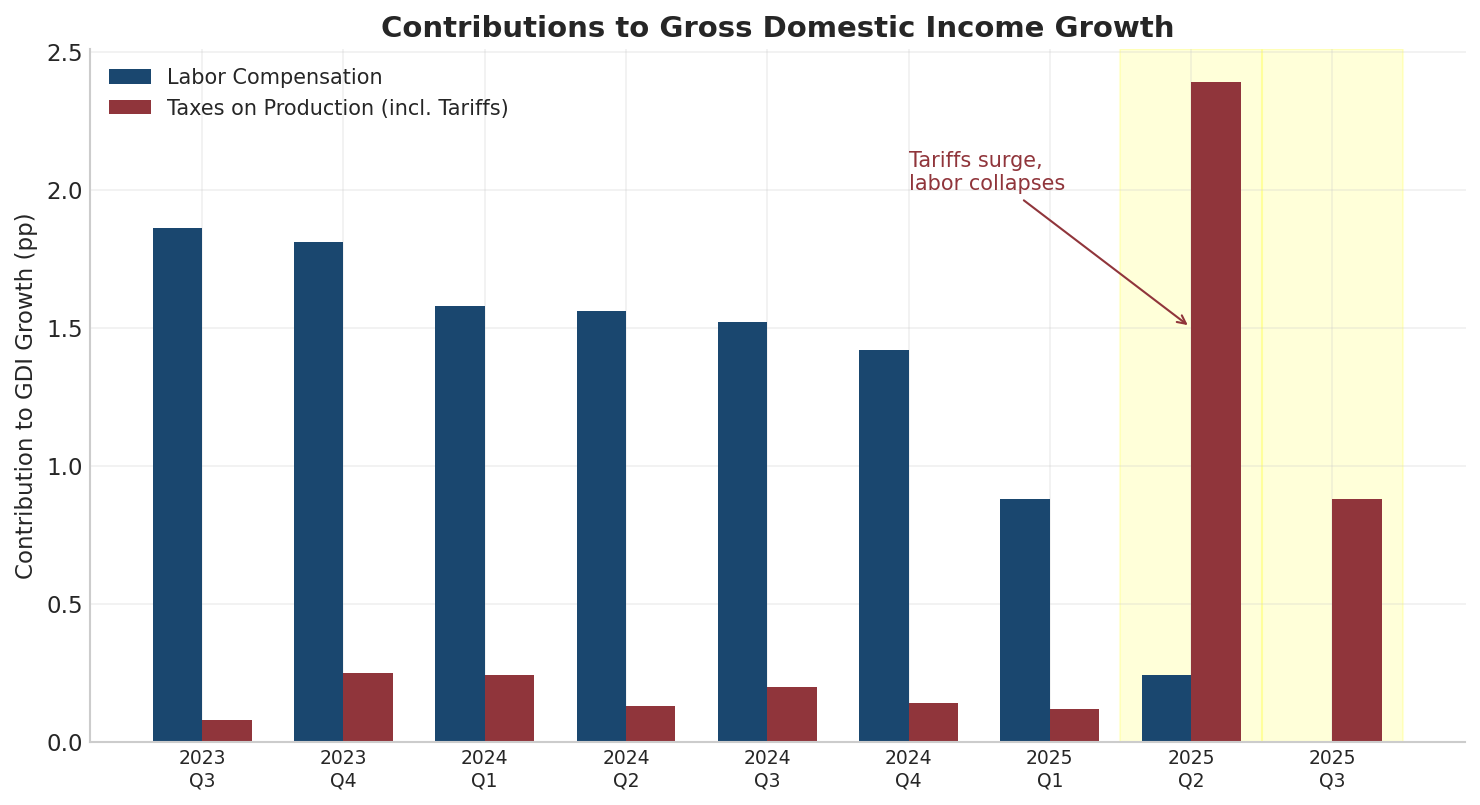
Over the same period, taxes on production (which include tariffs) surged from absorbing 0.2 percentage points of GDI growth to explaining over 1.4 percentage points of GDI growth.
The timing is striking. Whether the relationship is causal or coincidental, the tax shift toward tariffs coincided with a sharp decline in labor’s share of income growth.
The Fragility
So if wages aren’t supporting consumption, what is?
The answer may be wealth effects. When stock portfolios rise, wealthy households feel richer and spend more, even if their paycheck doesn’t change. This is well-documented in the economics literature and is one reason the Federal Reserve watches asset prices closely.
The problem is that current stock market valuations are historically unprecedented.
One way to measure this is Tobin’s Q, named after economist James Tobin. It compares the market value of corporations to their replacement cost (what it would cost to rebuild all their factories, equipment, and inventory from scratch). When Q is high, the market is valuing companies far above their tangible assets. The Federal Reserve reports this in the Financial Accounts of the United States.
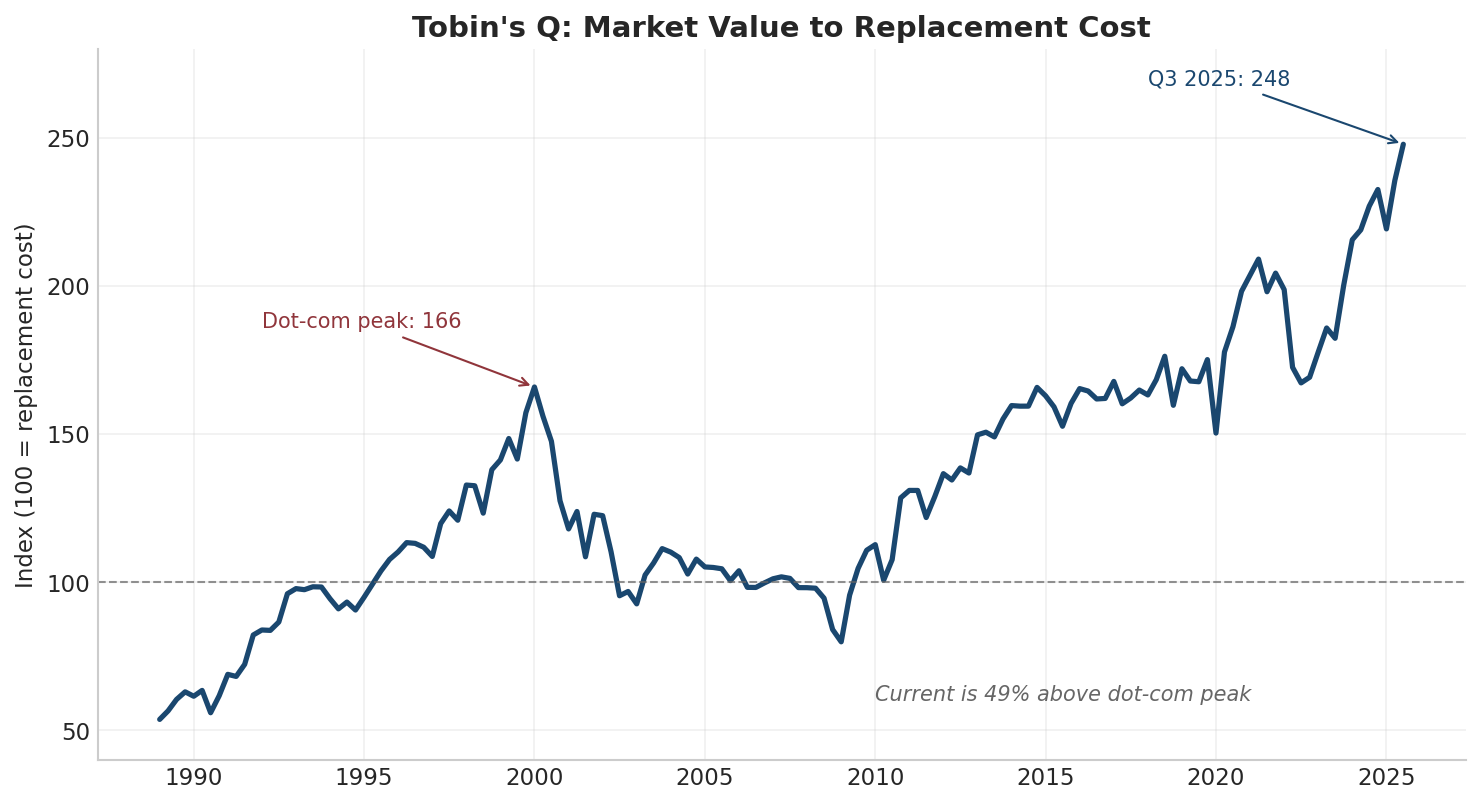
Tobin’s Q currently stands at 248. At the peak of the dot-com bubble in 2000, it reached 166. The market is 50 percent higher now than at the height of the 2000 bubble. This is the highest reading in the history of the series, which goes back to 1945.
This is not a stable foundation. Wealth effects work in both directions. If valuations correct toward historical norms, the spending they support will contract. The upper arm of the K, consumption by wealthier households, depends on asset prices that have never been this stretched.
The Consequence
The K-shaped economy is often discussed as if it were a natural market outcome. But what we’re seeing in 2025 reflects a policy consequence.
The tax structure shifted from progressive to regressive precisely as labor income stagnated and lower income spending stalled. The GDI and wage data show labor’s income collapsing while tariff revenue surged. Lower-income households now face higher consumption taxes with no wealth buffer to cushion the blow. Higher-income households remain insulated, for now, by equity gains from a historically elevated stock market.
The distributional effects are clear. A tax system that relied more heavily on corporate profits and less on consumption has been replaced by one that does the opposite. The burden shifted downward.
The question is how long this equilibrium can hold. Wealth effects depend on valuations that are unprecedented. If the stock market corrects, the upper arm of the K loses its support. And the lower arm was never supported to begin with.