
MacroeconomicsPrices & InflationTrade & International
China is exporting cheap capital goods to the world
In 1950, the Argentine economist Raul Prebisch published a finding that would shape development economics for decades: the prices of commodities exported by poor countries were falling relative to the manufactured goods they imported from rich ones. The structure of global trade, he argued, transferred the productivity gains of the periphery to the center. Poor countries grew the coffee; rich countries sold the tractors.
Seventy-five years later, something has inverted. China was itself part of Prebisch’s periphery within living memory. Today it is the world’s largest exporter of manufactured goods. And what it exports is solar panels at eight cents per watt, electric vehicles that outsell combustion engines, container ships, and steel. The capital goods that countries need to generate electricity, move goods, and build infrastructure.
The trade data tells this story. The trade data also understates the scale, because trade is measured in dollars, and when prices fall, each dollar carries more physical goods than it used to.
China is the top import source for 81 countries
World merchandise trade as a share of global GDP has stagnated since the 2008 financial crisis. Within that plateau, China’s position has transformed.
China is the top import source for 81 countries. The United States is the top source for 29. Germany for 18.
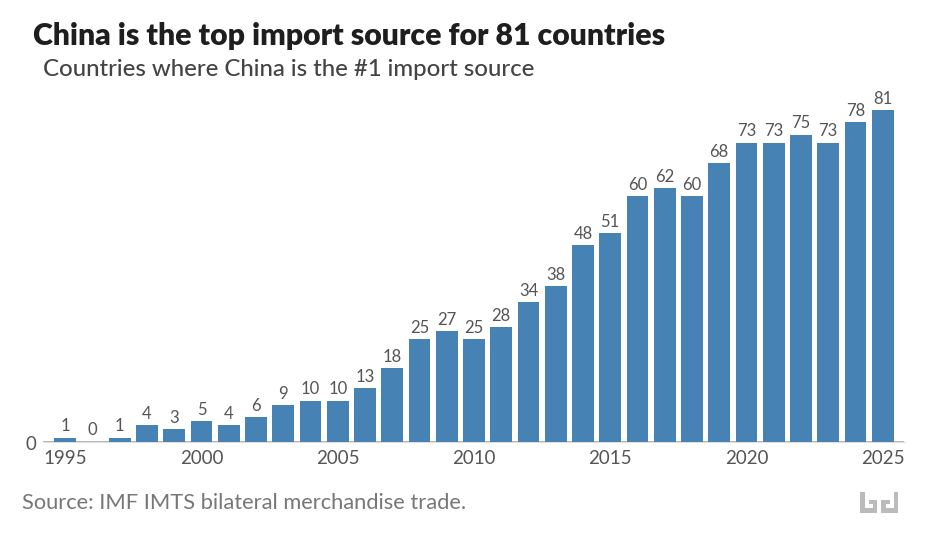
In 1995, China held this position for one country. By 2005, ten. By 2015, fifty-one. China is in the top three import sources for 164 of 207 countries. Only three have China outside their top ten: the Falkland Islands, Gibraltar, and Mauritius.
The countries making this switch span every income level. China is the top source for South Korea, Japan, Australia, and Norway. It is also the top source for most of the world’s lowest-income countries. The median country now sources about 15 percent of its imports from China.
And the pattern of displacement is consistent: countries are switching away from former colonial and hegemonic trade partners. France lost most of francophone West Africa. The United States lost much of Latin America and the Gulf. Japan lost most of East Asia. Russia lost Central Asia. The United Kingdom lost several Commonwealth nations.
What these countries are buying, increasingly, is capital goods.
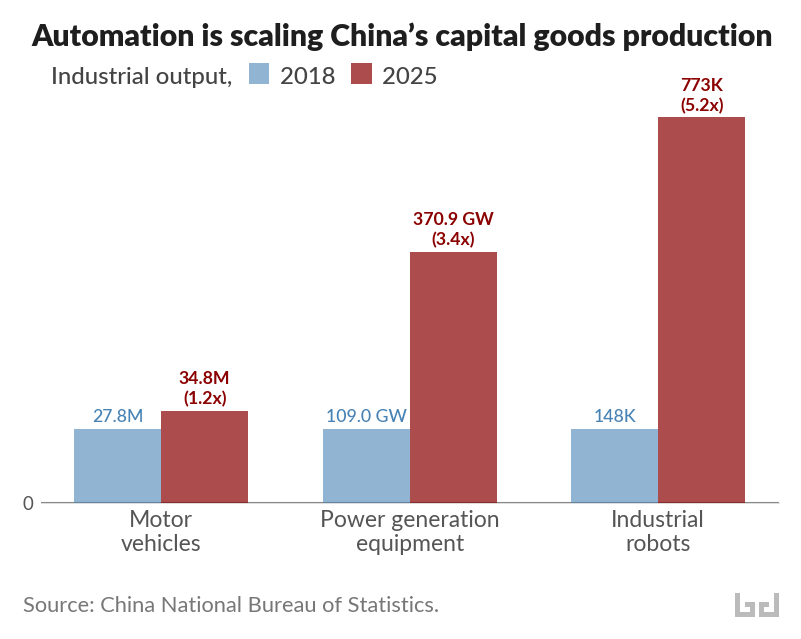
Automation is driving a surge in capital goods production
The conventional image of Chinese exports, cheap consumer goods and textiles, is twenty years out of date. Apparel fell from 8.7 percent of China’s exports in 2005 to 3.9 percent in 2025. What grew was electrical machinery, vehicles, ships, and steel.
The scale of this shift becomes clearer when measured in physical output rather than dollar values. Chinese factories produced 370.9 gigawatts of power generation equipment in 2025, 3.4 times the 2018 level. Motor vehicle production reached 34.8 million units, up from 27.8 million. And output of industrial robots hit 773,000 sets, 5.2 times the 2018 figure. China now installs more industrial robots annually than the rest of the world combined.
These categories reinforce each other. Robots automate the factories that produce vehicles and power equipment. Power equipment runs the factories that produce the robots. The result is a manufacturing system that scales up output while pushing unit costs down, a virtuous cycle that resembles what the Gutenberg press did for books: transforming expensive, labor-intensive goods into mass-market commodities.
Falling prices deliver an eightfold increase in solar exports
When the price of an exported good falls dramatically, each dollar buys more. For the countries importing Chinese capital goods, falling prices amount to a transfer of value from Chinese producers to foreign buyers. Solar panels are a striking example. Using data from Ember, which tracks Chinese customs records on solar exports by destination, we can measure the same trade flow in megawatts of generating capacity, in nominal dollars, and as a share of world GDP.
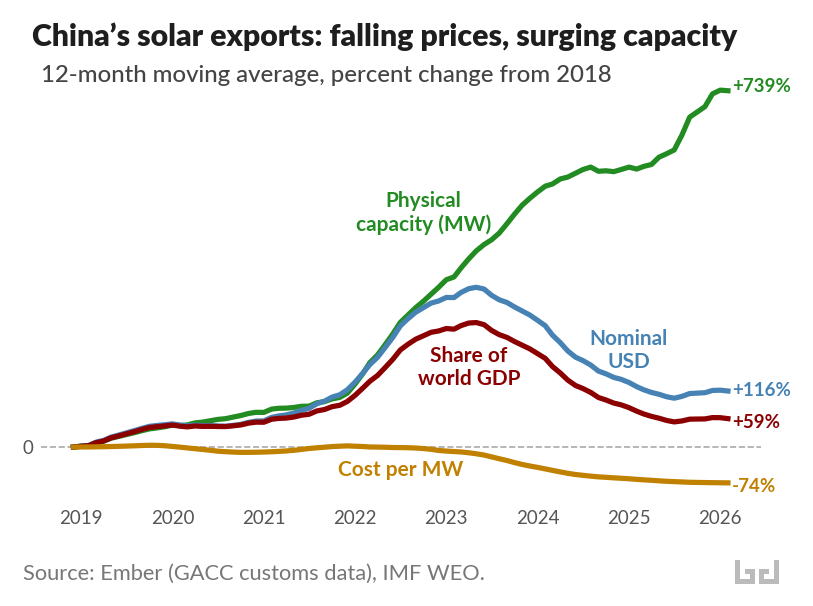
Since 2018, the physical capacity of Chinese solar exports has increased by more than 700 percent. In nominal dollar terms, exports only doubled. And as a share of world GDP, Chinese solar exports grew by just 59 percent.
The gap between physical and dollar growth reflects a price collapse: the cost per megawatt of exported solar capacity fell about 75 percent. A megawatt of Chinese solar panels that cost $261,000 in 2018 costs roughly $67,000 today.
This price collapse is transforming energy access in the developing world. In Africa, solar panel imports from China surged 60 percent in the twelve months through mid-2025, reaching 15 gigawatts. Sierra Leone alone imported solar capacity equivalent to 61 percent of its 2023 electricity generation. In Pakistan, Chinese panels at eight cents per watt are cheaper than the grid, and the country has avoided an estimated $12 billion in fossil fuel imports since 2021 by deploying rooftop solar. In Cuba, imports of Chinese solar panels grew 34-fold between April 2024 and April 2025, taking the island from zero to roughly 10 percent of electricity generation from solar in about a year. In Lebanon, cheap Chinese solar technology replaced the diesel generator networks that had powered the country for years.
And the price gap is widening beyond solar panels. China’s real effective exchange rate measures, in a single number, how expensive Chinese goods are relative to those of its trading partners, adjusted for inflation. It has fallen 15 percent since early 2022, reaching its weakest level since 2012.
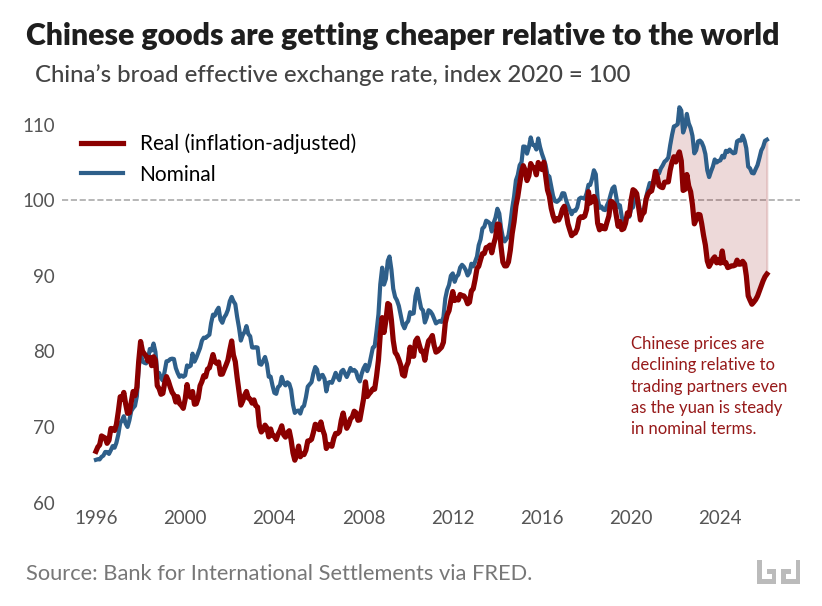
The chart above shows why this matters. The blue line is the nominal exchange rate of the yuan, trade-weighted against China’s partners. It has been roughly stable since 2020. The red line adjusts for relative price levels: it falls when Chinese goods get cheaper relative to the rest of the world. The shaded gap between them has been widening since 2020, driven by diverging price trends. Producer prices in Europe rose 35 percent over the past five years, and 26 percent in the United States. Chinese producer prices over the same period were flat or falling. The same nominal exchange rate now buys considerably more Chinese output than it did five years ago.
The decline is surprising. In standard economic theory, a country with rapid manufacturing productivity growth should see the red line rise. Productivity gains flow to workers as higher wages, higher wages push up domestic prices, and the real exchange rate appreciates. The same pattern held during the industrialization of Japan and Germany. Economists who studied an earlier episode of the same pattern in China called it “China’s real exchange rate puzzle,” and traced it to total factor productivity growth.
The robot data offers a more specific explanation. When productivity gains are embodied in labor, as in postwar Japan, wages rise and domestic prices follow. When productivity gains are embodied in capital, as in factories deploying industrial robots at unprecedented scale, wages face less upward pressure. The cost savings flow into lower goods prices instead. The widening gap between the two lines is the productivity revolution, made visible in prices.
The terms of trade for capital goods are moving in favor of the buyers
Raul Prebisch observed that manufacturing productivity gains in the United States were, as he put it, “not passed on through prices” but instead absorbed as higher wages and incomes. The prices of manufactured goods held steady while the prices of commodities fell. The peripheral countries that exported coffee and copper saw their terms of trade deteriorate. The rich countries that exported tractors and turbines kept the surplus.
China has inverted this mechanism. Its productivity gains are being passed on through prices. The cost savings from 773,000 industrial robots per year flow outward, through containers of solar panels and electric vehicles, to the countries that import them. At a scale and breadth that has few historical precedents, the terms of trade for capital goods are moving in favor of the buyers.
Falling prices are what countries are responding to. The switch from France or the United States or Japan to China as top import source is, in most cases, a response to prices. Chinese machinery costs less. Chinese solar panels pay for themselves in months. Chinese electric vehicles dominate markets from Thailand to Brazil. The calculus is straightforward, and for importing countries, the outcome is more capital goods for the same money.
Prebisch worried that the periphery would remain trapped, exporting cheap commodities and importing expensive machines. The machines are getting cheaper, and they are arriving without conditions. The countries that need them most are getting more of them than ever before.