Labor MarketPolicy
The Hiring Freeze and Who It Traps
The unemployment rate has risen to 4.4% — still low by historical standards, but up from 3.4% two years ago. Underneath that number, hiring has stalled, job searches are lasting longer, and a growing number of people have stopped looking altogether. This is what a hiring freeze looks like — and it is a different kind of problem than the recessions our policy tools were built for.
Hiring, quitting, and job-switching have all slowed
Hiring has slowed steadily.
| 2021 peak | 2018-19 average |
Now | |
|---|---|---|---|
| Monthly hires | 6.9M | 5.8M | 5.3M |
| Share of workers quitting | 3.0% | 2.3% | 2.0% |
| Job openings per unemployed person |
2.0 | 1.2 | 0.9 |
Employee turnover hit a nine-year low in January 2026, and the pay bump workers get for switching jobs is at its lowest since 2017. Workers are behaving accordingly: the NY Fed’s Survey of Consumer Expectations shows the share of employed people who expect to voluntarily leave their job fell to 15.9% in February — the lowest in the survey’s history.
The most affected group is people looking for their first job. Unemployment among college graduates aged 22-27 has risen to 5.6%, sharply above the overall rate, with over 40% in jobs outside their field. The Cleveland Fed found that the rate at which unemployed graduates find work has fallen from 47% to 37% since 2000, and that high school graduates now exit unemployment faster than college graduates — a reversal of the historical pattern.
A different kind of deterioration
The Sahm rule, a widely watched recession signal based on rising unemployment, triggered in mid-2024 and has since receded. A slow rise in unemployment captures only part of what is happening. The number of people unemployed 15 weeks or longer has risen 45% since 2023. Another 6 million people want a job but have stopped actively searching — a population entirely outside the unemployment rate.
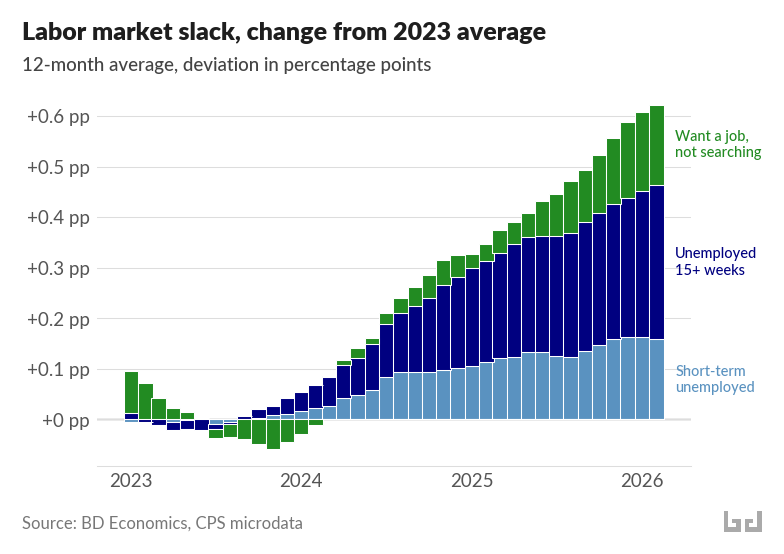
Using the Current Population Survey, I counted everyone who wants work — whether they are actively searching (and counted as unemployed) or have given up searching (and are not counted). As a share of the population, this group has grown steadily since 2023, and totals about 13 million people over the last 12 months of data.
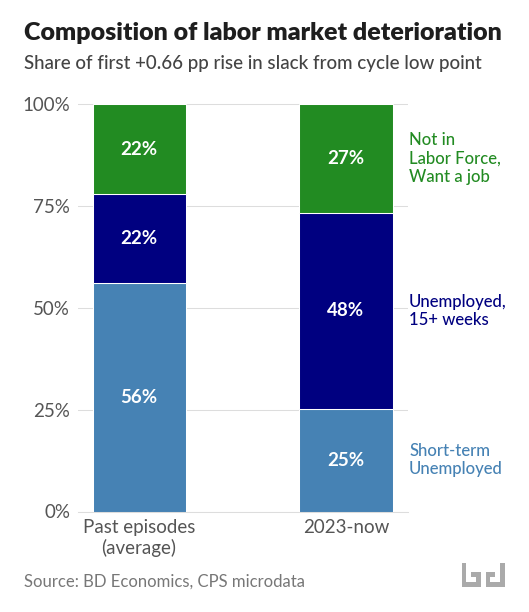
What makes this episode different is where the increase is coming from. In the dot-com recession, the Great Recession, and COVID, the increase was driven mainly by a wave of people losing jobs — newly unemployed workers who had been searching for less than 15 weeks. In the current episode, that group accounts for just 25% of the increase. Nearly half comes from people who have been unemployed 15 weeks or longer, and over a quarter from people who have stopped searching entirely.
Duration is a trap
Employers treat nine months without work as equivalent to four years of lost experience. Skills atrophy. Job searchers lose motivation. A Minneapolis Fed analysis found that long-term unemployment has trended upward for decades, and that workers who start looking for work during downturns experience earnings losses that persist for years.
This pattern — where time out of work makes it harder to find work — is well-documented among the unemployed. Survey data shows it operates among people outside the labor force too: the longer someone has been wanting work without finding it, the lower their already dismal chances of getting back in — and those chances have been falling. This is a population of millions that the unemployment rate does not track.
The labor market entered 2026 with less cushion than it had in 2022. The surplus of job openings that supported the labor market in 2022-2023 has closed, and the pandemic-era savings buffer has been depleted. If hiring remains frozen, people stuck in long job searches and people who have stopped searching have fewer paths back in than they would have had two years ago.
Policy for a freeze, not a crash
Unemployment insurance was designed in 1935 for temporary layoffs: lose a job, collect benefits, get rehired when demand recovers. That system was built for a different problem. Only about a third of unemployed workers receive unemployment benefits. Young people looking for their first job qualify for nothing at all.
Meanwhile, about 6 to 7 million people per year lose work and want a new job, but never show up in the unemployment statistics because they are not actively searching. Most are part-time or self-employed workers who face severe eligibility barriers. The safety net largely misses them.
There are concrete proposals for reform. One would establish a minimum unemployment benefit available to all jobseekers regardless of work history. Wage-loss insurance — supplementing the pay of workers who find new work at lower wages — would cost an estimated $2.6 to $4.3 billion per year.
Beyond reforming unemployment insurance, some countries invest directly in helping people find new work — through job placement services, retraining, and training programs tied to specific industries. The US spends 0.1% of GDP on these active labor market programs. Denmark spends 2%, and sees substantially higher rates of people finding new work. Similar programs included in US trade adjustment assistance resulted in persistent earnings gains for workers who participated.