
Labor MarketWages & Income
The Gender Wage Gap in 2025: Bigger Than You Think
The gender wage gap widened in 2025. Women working full-time now earn about 82 cents for every dollar paid to their male counterparts, down from the 83 cents reported in 2023. But that familiar statistic actually understates the problem—possibly by a lot.
The Official Number
One standard way to measure the gender wage gap compares median weekly earnings of full-time wage and salary workers. Using the same methodology as the Bureau of Labor Statistics on 2025 data, I estimate that men now earn $1,323 per week while women earn $1,081—a gap of about 18 percent.
But this headline number understates the problem. The chart below shows four different ways to measure the gap—and each adjustment reveals a larger disparity.
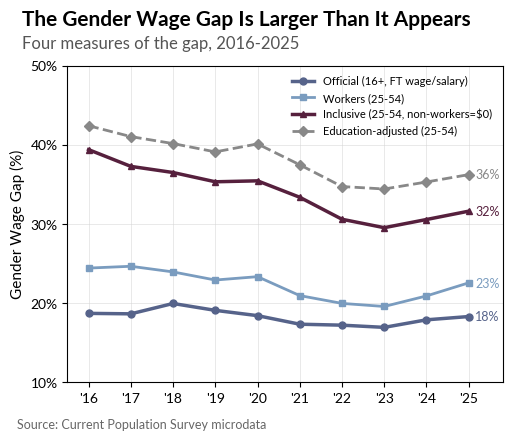
The dark blue line is the official measure. The maroon line includes all adults aged 25 to 54, treating non-workers as earning zero. The gray dashed line adjusts for education. By the top line, the gap has doubled from 18 percent to 36 percent.
The Median Worker Isn’t the Median Person
Any wage statistic has to decide who counts. If we included everyone—children, stay-at-home parents, retirees—the median wage would be close to zero, since only around half of the full population actually receives a wage.
So wage statistics focus on workers. But this creates a problem: men and women don’t work at the same rates. If we look at the subset of people with the highest employment rates, those aged 25 to 54, the employment gap is substantial: about 86 percent of these men are employed compared to 75 percent of women.
Think of it this way: if you lined up all prime-age men from lowest to highest earnings—including those with zero—you’d find the median worker at roughly the 57th percentile. Do the same for women, and you’d have to go further up the line—to the 63rd percentile—before reaching the median worker, because more women are at zero.
The standard wage gap compares these two different points in the distribution. It’s not apples to apples.
What If We Compared Apples to Apples?
When we calculate an “inclusive” measure—counting everyone and treating non-workers as earning zero—the gender wage gap jumps to 32 percent. Now we’re comparing the actual median man to the actual median woman.
This gap reflects the full income disparity between men and women—including the effect of lower employment rates among women, often tied to caregiving responsibilities that still fall disproportionately on them.
There’s also a selection effect. The women who do work aren’t a random sample—they tend to be those with higher earning potential. If all women worked at the same rate as men, the average working woman’s wage would likely fall, and the measured gender wage gap would grow larger still.
The Education Puzzle
The inclusive measure already accounts for who’s working. But there’s another factor hiding part of the gap: education.
Women have been out-educating men for over two decades. Today, among all prime-age adults—working or not—19 percent of women hold advanced degrees compared to 14 percent of men. For bachelor’s degrees, it’s 29 percent versus 26 percent. This isn’t just about who selects into work; women as a group have more schooling than men.
Economic theory says higher education should mean higher wages. So women’s education advantage should be shrinking the wage gap. And it is: when we statistically adjust for education—asking what the gap would be if men had the same credentials as women—the gender wage gap rises from 32 percent to 36 percent.
In other words, education is masking part of the problem. Women’s superior schooling is compensating for some other systematic disadvantage in the labor market. The gray dashed line in the chart shows what the gap would look like if we removed this educational cushion.
Four Ways to See the Gap
Putting it all together:
| Measure | Gap | Women’s Earnings |
|---|---|---|
| Official (16+, FT wage/salary) | 18% | 82 cents |
| Workers (25-54) | 23% | 77 cents |
| Inclusive (25-54, non-workers=$0) | 32% | 68 cents |
| Education-adjusted (25-54) | 36% | 64 cents |
What does this mean in dollars? At 2025 median wages, the official 18% gap costs women about $12,600 per year. Over a 30-year career, that’s roughly $380,000. If the true gap is closer to 36%, the annual cost doubles to $25,000—and the lifetime total approaches $750,000.
Look again at the chart. All four lines tell the same story: progress through 2023, then reversal in 2024-2025. But they tell that story at very different levels.
Recent Developments and Closing the Gap
How long until the gap closes? At the ten-year average rate of change, the answer is the year 2437. Even before the recent reversal, progress had slowed to a crawl—the 2016-2023 trend pointed to 2090. The gender wage gap closed far faster in the 1980s. Recent decades have seen near-stagnation, and now we’re moving backward.
What’s behind the reversal? Digging into the data, men’s wages grew faster than women’s within nearly every major industry—including education and health care, where women make up the majority of workers. This isn’t about women shifting into lower-paying fields. It’s about men’s wages growing faster across the board.
The 82-cents figure captures only part of the problem. The gender wage gap isn’t just about unequal pay for equal work. It’s about who gets to work, whose work gets counted, and whose contributions get valued.
When women’s work is underpaid—or unpaid entirely—the whole economy suffers. Finance depends on childcare. Programmers depend on nurses. Every sector relies on every other. Closing this gap isn’t charity. It’s recognizing that the economy is interconnected, and that undervaluing half the population holds everyone back.
Analysis based on Current Population Survey microdata. Official figures use full-time wage and salary workers age 16+. Inclusive and education-adjusted measures use ages 25-54. Education adjustment reweights men to match women’s education distribution. Wages are imputed for self-employed based on similar wage and salary workers.