
Labor MarketPrices & InflationWages & Income
Income growth is slowing. For low-paid workers, real wages are falling.
March inflation jumped to 3.3% year over year, up from 2.4% in February. The main driver was gasoline as the Iran war pushed pump prices from $2.98 to $4.15 a gallon. Core inflation held at 2.6%, for now.
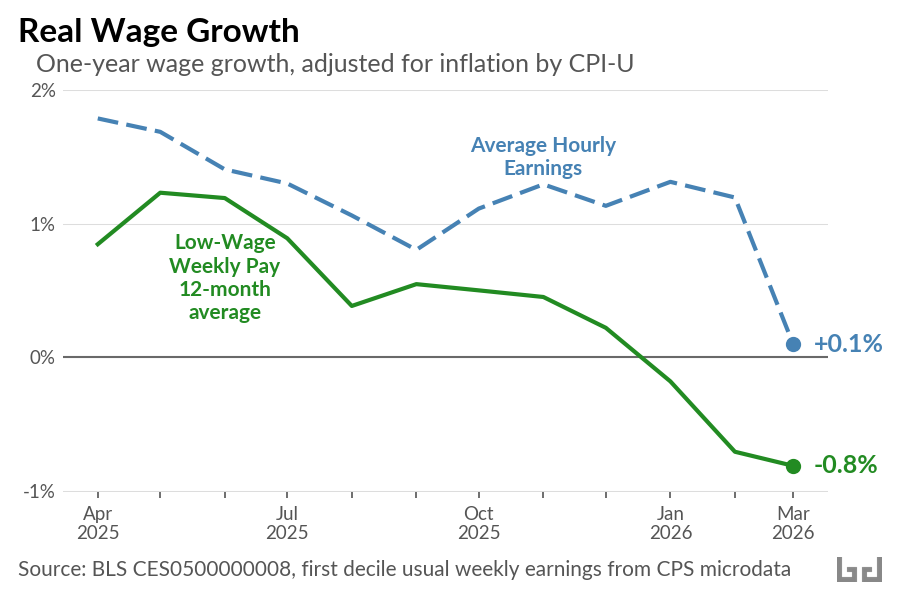
The price spike hit already-soft wage growth. Average hourly pay for production and non-supervisory workers rose 3.4% over the year ending March, down from 3.7% in January and February. Adjusted for inflation, real hourly pay grew 0.1% in March, after 1.2% in February. Workers at the bottom, where nominal growth has been slowing the longest, went negative. The 12-month average of real weekly pay at the first decile is down 0.8% over the past year.
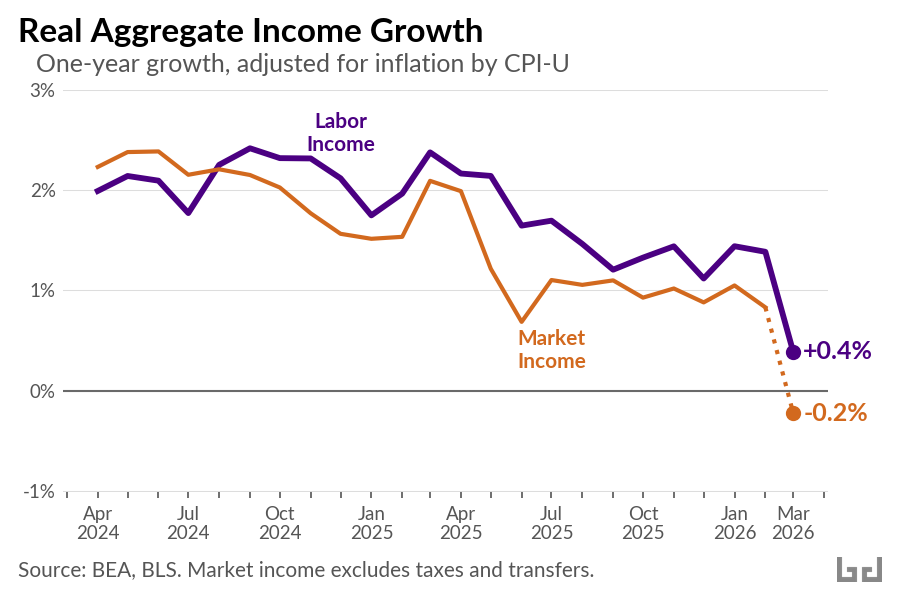
Aggregate income tells the same story. Gross labor income, total pay across the workforce, rose 3.7% nominal in March, down from 4.8% a year earlier. Deflated by the CPI, real labor income is growing 0.4%. Real market income, personal income excluding taxes and transfers, is flat, and likely turned slightly negative in March once the CPI spike is reflected.
Three forces are pushing this lower.
First, demographic. A new FEDS Note by Murray and Vidangos shows labor force growth slowing to near zero in 2026, the weakest in modern US history. With immigration collapsed and the population aging, the monthly payroll number needed to hold the employment rate steady has fallen below 10,000. Soft headline prints are partly structural, not just cyclical.
The cyclical side is real, too. Hiring has slowed sharply. JOLTS shows 4.8 million hires in February, down from a 2019 average of 5.8 million. Openings are 6.9 million and the quits rate is 1.9%, near a decade low outside the pandemic. When the labor market runs hot, workers have leverage. They switch jobs, negotiate, and pull wages up. That leverage has faded.
Prices are the third piece, and the March data is where all of this shows up. Before the war, tariffs were already pushing core goods inflation higher. The Iran war then pushed gasoline 39% higher, lifting March CPI to 3.3% year over year. The result is the single worst month for real hourly pay in roughly four years.
Looking forward, the OECD forecasts US inflation at 4.2% in 2026, the highest in the G7. If that path holds, the March flip in real market income will not be a one-month event.
And one cushion households had counted on is gone. Markets priced in a steady path of Fed rate cuts earlier this year, which would have eased mortgage and other borrowing costs. The federal funds target now sits at 3.5 to 3.75%, and those cuts have been pushed out indefinitely. That relief is off the table.