
Labor MarketPolicyPrices & Inflation
Why Fewer People Are Out of the Workforce for Family
Consider household composition
As prices rise again, the question is which households suffer.
One standard answer points to low-income households. A larger share of their income goes to essentials, so price increases hit them harder. This is true, but it is a partial explanation. Households also differ in how many household members work for pay and how many depend on them, and the ratio between these groups matters even when wages outpace inflation.
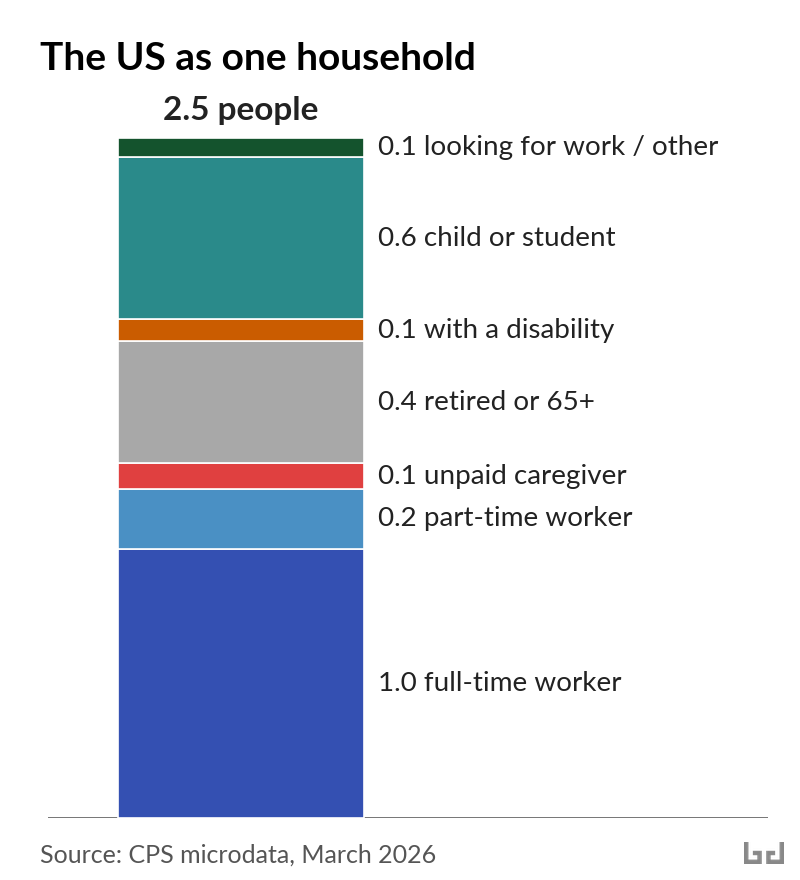
When scaled to a single 2.5-person household, the US population looks like this: about one full-time worker, two-tenths of a part-time worker, and the rest a mix of children or students, retirees, unpaid caregivers, people with disabilities, and people looking for work (see chart 1). Those are population averages. No household actually contains 0.6 of a child or 0.4 of a retiree.
Real households contain whole people. Some households consist of two earners and no children. Some have one earner with a spouse and three children. Some are two retirees on a fixed pension. Some are a single parent with two children and one elderly grandparent.
When wages adjust to match prices, both paychecks rise in a two-earner household. In a one-earner household with four dependents, only one paycheck rises, and that paycheck still has to feed five mouths. Each person in the household has consumption needs whose prices have risen. The more people per earner, the more total inflation pressure the household carries. Let’s look at how families respond to that pressure.
Changes in participation: three illustrative groups
Since 2022, fewer women in the US have been out of the workforce for family or caregiving reasons. The count fell from 12.3 million in March 2022 to 11.3 million in March 2026. That move is part of a broader rise: when adjusted for age, women are participating in the labor force more now than at any point in the past.
While progress on women entering the labor force largely stalled from 2000 to 2015, it has recently accelerated. The long arc points to higher workforce participation. About 70% of middle-class kids grew up with a stay-at-home mom in 1960; the share has fallen to about 20% in 2024.
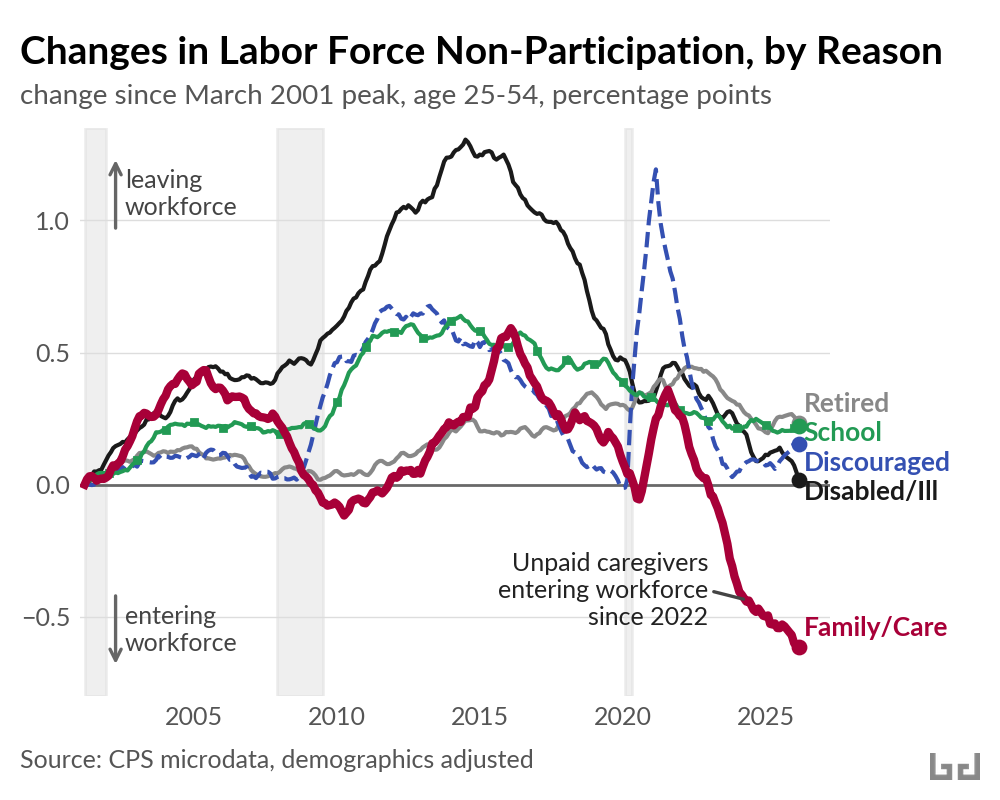
Among adults age 25 to 54, the main reasons for labor force non-participation are as follows: family or caregiving, disability or illness, school, early retirement, or no longer looking for work. In March 2001, US labor force participation was near its all-time high, and since then the reasons for increased non-participation have varied (see chart 2). By 2022, the share out of the workforce for family or caregiving reasons was back at the same level as in 2001. But the share has fallen sharply since.
Within this shift in labor force participation, three illustrative groups of women responded differently, depending on the daily care needed at home.
1. Women without children at home
Slightly more than half of the move out of family roles came from married women without children at home. The share of the group staying home for family fell from 5.0% to 4.4% between 2022 and 2026.
When there are no children at home, time previously kept for unpaid family work can go to paid work without the need to buy daycare. Following the pandemic era spike in cost of living, hundreds of thousands of women in this group entered the labor force.
2. Mothers of one-year-olds
Mothers of one-year-olds did not follow the same pattern. Their share staying home for family was 30% in both 2019 and 2026, even as workforce participation among other groups of women rose.
An infant requires care during most of the waking day. The US doesn’t fund public daycare for infants at any meaningful scale. Federal pandemic-era funding that had helped some low-income families afford private infant care expired in September 2023.
For households where one parent stays home with an infant, a second wage often wouldn’t cover replacement childcare. Center-based infant care can cost as much as a parent’s paycheck. When prices rose between 2022 and 2024, that calculation did not change in favor of paid work.
3. Mothers of three- and four-year-olds
Mothers of three- and four-year-olds did move into paid work. Their share staying home for family fell from 24.5% to 22.7% between 2022 and 2026. Their employment rate rose by nearly two percentage points.
By age 3 or 4, kids need less hands-on care than infants. Public pre-K can cover much of what’s still needed. Twelve states fund universal or near-universal pre-K for four-year-olds, with several hours of supervised care per weekday.
In states with public pre-K, mothers of three- and four-year-olds moved into paid work between 2022 and 2026. Where public childcare reaches, paid work and family work both fit into the day.
Who loses when prices rise
When prices rise, households with more dependents shoulder more of the increase. The 2022-2026 family-care decline is one slice of that pattern.
In households where the adults all work and there are no children, poverty stayed at 5.4% across the 2019-2024 period. In households with one dependent (a child or non-working adult under 65), the poverty rate climbed from 12% to 14%. With three or more dependents, poverty climbed from 18% to 20%, about one in five. Where someone wasn’t earning, poverty rose about two percentage points across the period.
Households have consolidated, too. As one example, the share of Americans aged 18 to 29 living with family was 48% before the pandemic; it crossed 50% in 2023 and reached 53% by March 2026. When the cost of forming a new household increases, more adult children stay home or move back in, a shift in living arrangements that spreads costs.
Other rich countries let fewer prices land entirely on households. They offer public services that absorb private costs (for example childcare and healthcare) and also provide direct cash transfers such as child allowances. Both tools achieve the same goal: fewer households where prices outpace income. The US uses neither of these tools at the same scale.
As prices rise again, the burden will land where it always does here, on the households where wages are stretched thinnest. Until something else is set up to absorb the burden of inflation, vulnerable households do.